


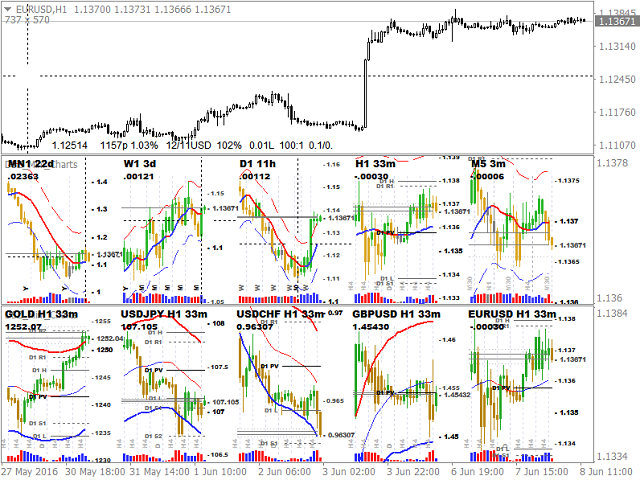

The indicator displays a chart (in the form of bars) of any timeframe and symbol. The product applies the “top-down” investment principle.
Charts have many features, including unique statistical levels, value rounding, pivots, elapsed time counting, order information, the ability to save and load graphical objects, and many others.
- Up to 9 charts in a row.
- Unlimited number of copies.
- Setting the symbol and timeframe for each chart.
- Moving averages with a unique calculation method.
- Unique statistical levels based on statistical distribution. On intraday timeframes, their ranges depend on the time of day.
- Pivot-support and resistance levels.
- Rounded valuesoptimized for each graph.
- The period separators and the elapsed time count.
- Mouse tracking – allows you to synchronize the time and prices on the charts.
- Fast operation thanks to caching.
- Data on the volume.
- Color schemes for price and volume.
- Order data in a simple format.
- Styles and colors.
- The ability to change the symbol and timeframe.
- Saving / loading custom objects when changing the symbol of the main graph.
- The names of all the parameters speak for themselves.
- The parameters in the All Charts section overwrite the values for individual charts with different symbols.
- Visible – enable / disable the chart.
- TF-timeframe of the chart.
- Symbol-a symbol (if the parameter is empty, the current one is used).
- MA