


Lack of momentum (events, news…) explains the price fluctuations in the range near the equilibrium level (called the spindle level), the appearance of large operations forces the price to go beyond the horizontal corridor (range) and take a direction.
- How to determine the level of equilibrium?
- How to determine the area of horizontal movement (range)?
- After going out of range, where will the next end of the movement be?
- And what will be the next level of equilibrium after this movement?
This indicator contains the answers to these questions:
The indicator works on charts with the H4 timeframe and less on all Forex instruments.
The indicator changes values when a new daily bar is opened.
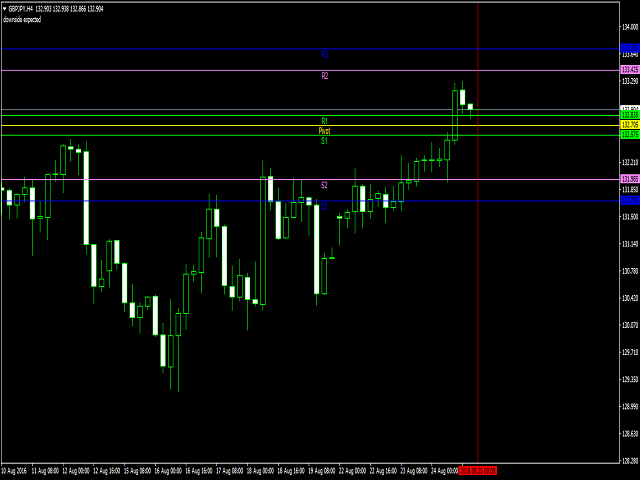
- The horizontal movement range is the interval between R1 and S1 (two green lines).
- A close below S1 means a high probability of further decline.
- A close above R1 means a high probability of further growth.
- The level R2 is the first barrier for moving up, and S2 is the first barrier for moving down.
- The price tends to return to the equilibrium region (between R1 and S1).
- Closing and stability below S2 opens the way to S3.
- Closing and stability above R2 opens the way to R3.
- Touching and stabilizing below R3 means a very strong sign of a downward turn.
- Touching and stabilizing above S3 means a very strong sign of an upward turn.
[spoiler title=”Read More…”]
- “fact” is the only input parameter. It allows you to adapt the interval. The recommended default value is “1.0”, less than ” 0.62 “for narrowing the interval, or” 1.62 ” for expanding.
The attached video shows the strategy of using this indicator, trial testing showed very good results!
To achieve the best results, use this indicator in conjunction with the forces series indicators:
[/spoiler]