


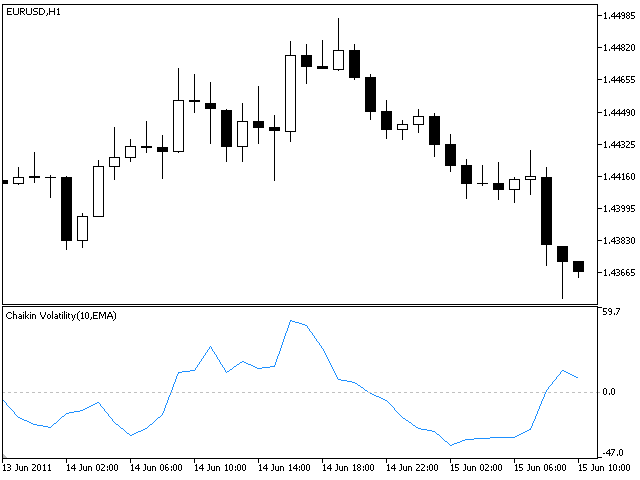

The Chaikin Volatility indicator (CHV) takes into account
changes in the spread between the maximum and minimum prices.
It determines the
amount of volatility based on the width of the range between the high and
low. At the same time , unlike the Average True Range, the Chaikin indicator does not take into account gaps.
According to Chaikin’s interpretation, the growth of the volatility indicator in a
relatively short time indicates that prices are approaching the bottom
(for example, in a panic reset of a paper), and the fall in volatility
over a longer period means that the top is close (for example, in
a mature bull market).