


This is a Dashboard Scanner for finding good trades using the GMMA method as base and TDI method for trend verification.
All buttons for all Pairs and Timeframes are clickable and will change the chart for you to that Symbol/TimeFrame.
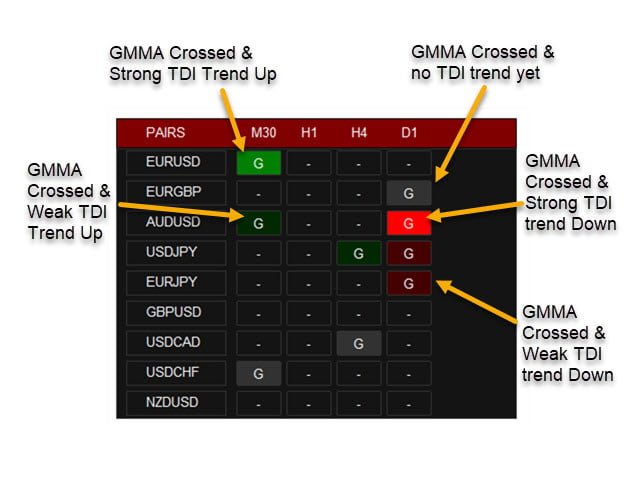
Green “G-Buy” button means good Buy Trend and Red “G-Sell” button means good Sell Trend.
Gray “G” means just a cross has happened but trend is not strong enough yet.
How Scanner finds the trades:
When short GMMA crosses Long GMMA upwards it will wait for some bars (customizable) for TDI to show strong BUY trend.
When short GMMA crosses Long GMMA downwards it will wait for some bars (customizable) for TDI to show strong SELL trend.
About GMMA In Brief:
GMMA attempts to identify trends by combining two groups of moving averages with differing time periods:
The long-term EMAs (30, 35, 40, 45, 50, and 60) the behaviors of investors that have taken a long-term approach to a given market. The short-term EMAs represent traders (3, 5, 8, 10, 12, and 18) who are attempting to capture short-term profits.
As you can see in the screenshots, blue lines are the short-term EMAs and red lines are long-term. So, buy when all of the blue lines cross above all of the red lines, and sell when the blue lines cross below the red lines. Right after a cross usually the red EMAs consolidate (get closer) and price has a slight reversal. Best time to buy is when the red EMAs start separating and price starts back again towards the trend using Count Back Line approach.
[spoiler title=”Read More…”]
More about GMMA:
Scanner Settings:
– Specify your Own Pairs using a comma-separated list. Or you can select a pairs list from our drop-down for forex pairs like “Forex Core 7”, “Forex Core 14”, only AUD pairs, only JPY pairs, etc.
– Specify your own preferred time frames in a comma-separated list. It is best to stick to higher Timeframes for GMMA Trades at least M30 or H1 . Because for lower timeframes you’ll see too many GMMA crosses and it won’t be very reliable.
– Settings for showing alerts: Popup, email, sound alerts, etc.
– WaitForCandles: 20 (default). After GMMA cross happens, wait for this many candles for trend to become strong (calculated using TDI).
– UseWeakTrend:
If true: When TDI shows even a Weak Trend, it will show a darker Green/Red “G” on dashboard
If false: Only use Strong TDI Trend signals.
– x_axis, y_axis to position Scanner Dashboard
– fontSize to resize the whole panel and it’s fonts. For best experience use fontSize between 5 and 8.
– Refresh After Ticks: Refresh indicator every x of ticks. So it works smoother.
Based on these settings: This indicator scans all the pairs you specify and all the timeframes for those pairs for when a GMMA cross happens. It then waits for “WaitForCandles” number of bars for trend to get strong. It uses the ” Traders Dynamic Index” to find if the trend is strong or not. Once it gets a good trend it will show up on the dashboard. Also TDI will check for Overbought/OverSold levels.
You can learn more about this method and see it working with other free indicators here:
How to Trade:
Best way to use this indicator is with Support and Resistance or Pivot points to know when the good trend might end. Or any other indicators which show reversal areas. And set Take Profits accordingly.
You can set StopLoss using the Count Back Line approach.
About Count Back Line:
Important Note:
Please don’t use too many Timeframes and too many Pairs because Scanner will need to scan each and every one and might get slower the more pairs you select.
Scanner scans every bar only once for GMMA cross. But it scans every tick for TDI strong signal. So that it can inform you immediately when trade is good.
Only trade trending markets with Higher timeframes. Don’t trade when market is sideways. Ranging markets will have too many GMMA crosses and will show unreliable signals.
[/spoiler]