


A new development created to facilitate trading. The indicator can be configured for both trend and counter-trend trading.
Acc PriceBalance will help you find new entry points or help you filter out existing signals.
- output of the histogram beyond the signal lines
- output of signal lines from the histogram
- changing the color of the histogram
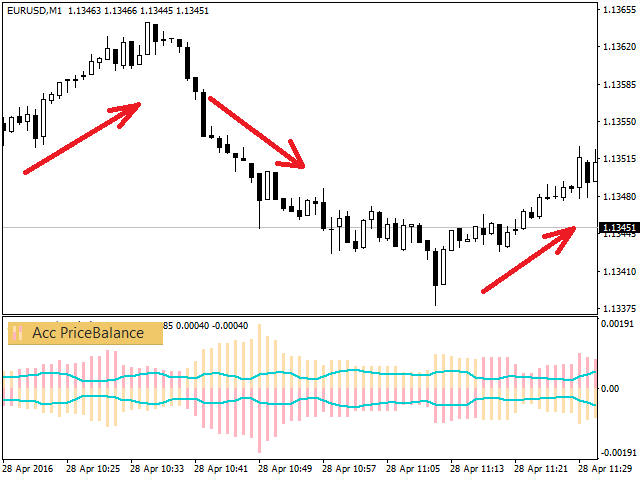
If the top of the histogram is pink, then there is a bullish trend in the market
If the bottom of the histogram is pink, then there is a bearish trend in the market
The indicator does not redraw on closed bars! We provide only good indicators!
The input parameters specify:
The value of the histogram is: (maximum price for the period – minimum price for the period) * 2
The color of the histogram changes when the maximum or minimum price for the period of bars is updated.
The price for plotting the indicator’s histogram can be set to Close or High/Low.
Signal lines are plotted using the Average True Range, using the ‘Lines multiplier’ parameter to adjust them.
The indicator also has a quick parameter change panel, which makes it very easy to find the optimal input parameters for any instrument and timeframe.
[spoiler title=”Read More…”]
Download a trial version for the test, maybe this is what you need!
I will be glad to receive any comments and suggestions for improving the indicator.
Also see our other products
[/spoiler]