


This product will allow you to profitably purchase and use two of the most popular products for analyzing the volume of orders and transactions on the stock markets:
This product has absorbed all the power of each individual indicator and is designed as a single file.
The functionality of the Actual COMBO Depth of Market AND Tick Volume Chart product is completely identical to the original indicators. You will appreciate the convenience of combining these two products into one super-indicator! Here’s what functionality you’ll get:
The professional tool of the best stock traders is now available on the MetaTrader 5 platform. The Actual Depth of Market Chart indicator visualizes a glass of stock orders in the form of a histogram,
placed on the price chart and updated in real time.
The indicator Actual Depth of Market Chart, you
directly on the chart to evaluate the applications of players in the market, and
also see big market makers. This will allow you to perform scalping with
jewelry precision, as well as be sure of the correct installation
stop orders for your positions.
[spoiler title=”Read More…”]
The indicator displays requests for
buy and sell in the form of horizontal histogram columns.
the corresponding colors (buy-sell). The column is displayed on the graph
prices, and its length corresponds to the total volume of requests at this level. At the
same time, the volume of the largest orders for buying and selling is additionally
signed.
The indicator displays the total
number of buy and sell orders in the form of a graph-an area with accumulation.
This allows you to estimate the total volume of applications that will be satisfied when
switching to a different price level. The total volume of purchase and sale orders is also
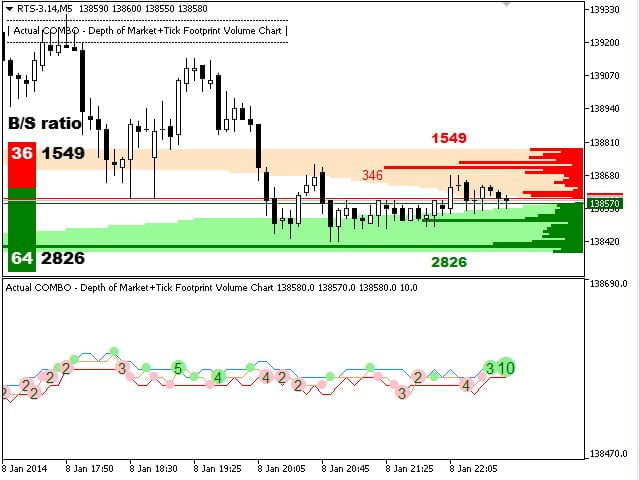
plotted on the chart. In addition, the Actual Depth of Market indicator displays the current ratio
the volume of purchase and sale orders (B/S ratio). The share is shown
the volume of applications of each type in the total volume of transmitted applications, as well as
the absolute value of the volume of open applications.
Default indicator
it is displayed in the background and does not interfere with the reading of other indicators on the chart.
When trading using this indicator, it is recommended to additionally
you focus on the real volumes.
This indicator will work
only on those instruments for which the bids of the bidders are broadcast.
First of all, it will be of interest to FORTS traders (FORTS) and other exchange
markets that the platform > MetaTrader 5 provides access to.
The indicator parameters allow you
to display the chart as conveniently as possible:
- Maximal volume of request (0 – autosize) – the maximum volume of applications,
corresponding to the length of the column. If 0 is specified, the length is selected automatically and is
equal to the volume of the maximum order in the glass. This parameter allows you to
fix the chart scale (the default value is 200). - Size of histogram bar – the length of the histogram column ( % ). The percentage of the window width that the application with the volume equal to the maximum will occupy
the volume of parameter 1 (the default value is 20). - Display the indicator on background – display the indicator on the background
the plan. Allows you to draw the indicator under the chart and other indicators
(the default value is true). - Show B/S ratio bar – display the B/S chart on the chart.
- Bar height (%of window height) – the height of the B/S chart (as a percentage of the window height).
The new unique indicator Actual Tick Footprint (Volume Chart) is designed for use in the
futures markets and allows you to see the volume of real transactions at that moment,
when they are committed. The Actual Tick Footprint (Volume Chart) indicator represents a significant
improved tick chart, which is supplemented with information about the actual volume
completed transactions at a certain price. In addition, this unique indicator for MetaTrader 5 allows you to
reliably recognize the type of transaction-sale or purchase.
Indicator, similar to the standard one
tick chart, builds three lines in a separate window:
- The Bid line.
- The Ask line.
- The Last line, on which the circles with
in numbers – the volume of the completed transaction at this price. The size of the circle corresponds to
the volume of transactions made, and the color – the type of transaction. The red color of the circle means,
the deal went on the Bid price (interpreted as a sale), green – it was at the Ask price (interpreted
how buying).
The indicator data is perfect
they are necessary for scalping trading in futures markets, because
they allow you to define a variety of patterns and get the information that you need.
not available to regular traders, for example:
- Transactions with exceptionally high
volume. In the future, the price at which these transactions took place is likely to be
act as a resistance. - What kind of transactions take place in a
certain range – buying or selling. This allows you to understand in which
direction the exit from the accumulation is expected. - Traders ‘ behavior during trading
momentum and level passage – does everyone buy or sell at a sharp price change? - … and many other situations.
The indicator has a built-
in filtering system and displays only new trades that pass at a
changed price or with an increased volume. Transactions with a volume of 1 lot
they are displayed, but not signed on the chart, which allows
you to focus on the main thing.
I recommend attaching
The Actual Tick Footprint (Volume Chart) indicator to the M1 or M5 chart and select the
optimal scale. This will allow you to make the optimal decision both when trading
scalpers and when searching for the optimal entry into the market at a higher level.
long term.
To understand the actions of players in the
market and interpret volumes, I recommend using this indicator in conjunction with my
other development-the Actual Depth of Market Chart product, which
it will show you a histogram of the market depth.
The indicator parameters allow you to
customize the appearance of the chart:
- Ticks on chart-number
the last of the displayed transactions. - Scale in pips – the height of the
vertical scale in points. It should be selected in accordance with the current
volatility. - Color volume buy – the color of the marker
transactions for the purchase. - Color volume sell – the color of the transaction marker for sale.
- Color label – the color of the volume signature on the trade marker.
Pay attention to some
features:
[/spoiler]