


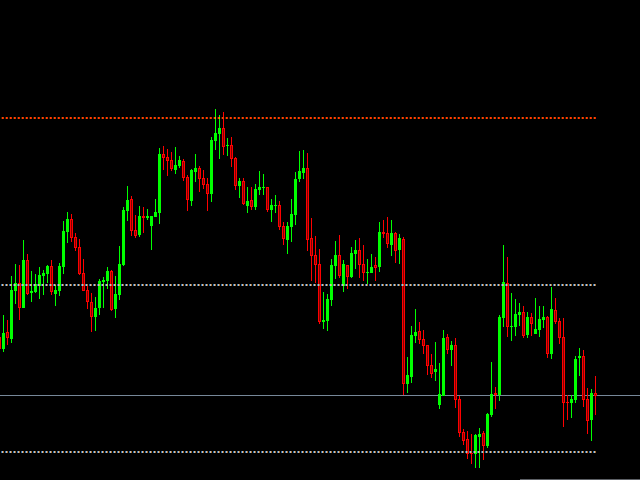

The indicator displays significant support and resistance levels, approaching which the price reacts in one way or another to the levels themselves or to the zones located in the immediate vicinity of these levels.
These levels can be considered as potentially reversal zones. Accordingly, the levels can be used to perform trading operations, or to close previously opened positions.
You can buy if the price is repelled from the support level from the bottom up, or sell if the price is repelled from the resistance level from the top down. You can also make trading operations on the breakdown of levels. So when the support level is broken (when the price is below the level) , you can sell. Conversely, when the resistance level is broken (when the price is above the level), it is possible to buy in anticipation of the price moving up to the next resistance level.
- Period – The period of calculation of the indicator for building levels
- Bars – How many bars the indicator is displayed for
- Normal levels – Color of normal levels
- Strong levels – Color of strong levels