


The new unique indicator Actual tick footprint (volume chart) is designed for use in
futures markets and allows you to see the volumes of real transactions at that moment,
when they are committed. The Actual tick footprint (volume chart) indicator is significantly
improved tick chart, which is supplemented with information about the actual volume
completed transactions at a certain price. In addition, this indicator, unique for MetaTrader 5, allows you to
reliably recognize the type of transaction-sale or purchase.
The indicator is similar to the standard one
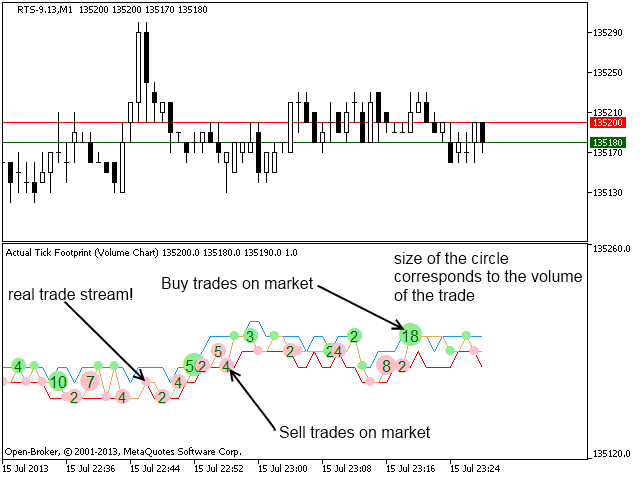
tick chart, builds three lines in a separate window:
- The Bid line.
- The Ask line.
- The Last line, on which the circles with
in figures – the volume of the completed transaction at this price. The size of the mug corresponds to
the volume of transactions made, and the color – the type of transaction. The red color of the circle means,
that the transaction was completed at the Bid price (interpreted as a sale), green color – the transaction was completed at the Ask price (interpreted
as a purchase).
The indicator data is completely
they are necessary for scalping trading on futures markets, because
they allow you to define a set of patterns and get the information that
it is not available to ordinary traders, for example:
[spoiler title=”Read More…”]
- Transactions with an exceptionally high
volume. In the future, the price at which these transactions took place is likely to be
act as a resistance. - What kind of transactions take place in a
certain range – buying or selling. This allows you to understand in which
direction the exit from the accumulation is expected. - The behavior of traders during
momentum and level passage – does everyone buy or sell when the price changes sharply? - … and many other situations.
The indicator has a built-
in filtering system and displays only new transactions that take place at a
changed price or with an increased volume. Transactions with a volume of 1 lot
they are displayed, but not signed on the chart, which allows
you to focus on the main thing.
I recommend attaching
The Actual tick footprint indicator (volume chart) to the M1 or M5 chart and select the
optimal scale. This will allow you to make the optimal decision both when
scalping and when searching for the optimal entry into the market for more
long term.
To understand the actions of players in the
market and interpret volumes, I recommend using this indicator together with my
other development-the Actual depth of market chart product,which
it will show you a histogram of the market depth.
The indicator parameters allow you to
customize the appearance of the chart:
- Ticks on chart-number
the last displayed transactions. - Scale in pips – the height of the
vertical scale in points. It should be selected in accordance with the current
volatility. - Color volume buy – the color of the marker
purchase transactions - Color volume sell – the color of the marker of the sale transaction.
- Color label – the color of the volume signature on the transaction marker.
Pay attention to some
features:
[/spoiler]