


The indicator predicts the most likely short-term price movement based on complex mathematical calculations.
- Estimation of the current price movement;
- Calculating the current trend;
- Calculation of the most important support and resistance lines;
- The algorithms are optimized for performing complex mathematical calculations with minimal consumption of system resources.;
- Self-adaptation to get the best result and, as a result, the
ability to work on any symbol (even the most exotic) and
timeframe; - Compatible with any MetaTrader platform regardless of the number of digits in the quotes and other parameters;
- Compatible with any other tool (indicator, Expert Advisor,
or script) without compromising terminal performance and slowing down
the speed of trading operations.
Note: To get values from different timeframes, accumulated data, and additional features, use the PRO and MASTER versions.
Note: To get values from different timeframes, accumulated data, and additional features, use the PRO and MASTER versions.
[spoiler title=”Read More…”]
Most of the standard indicators commonly used in trading
strategies are based on fairly simple calculations. This does not mean that at the
time of their creation there were no outstanding mathematicians in the world (in
fact, there were probably more of them then than now). It’s just that in those days
there were no computers or their power was not enough to
consistently perform complex mathematical operations. These days,
any smartphone is far superior to the capabilities of a computer, which was considered to be
the most powerful a few decades ago. Thus, the processing of
a large amount of information in our time is not a significant
limitation, except for the most complex modeling processes.
The Advanced Price Movement Predictor (APMP) uses state
-of-the-art computing power to analyze price fluctuations
using advanced mathematical, statistical, and probabilistic
methods.
APMP does not make forecasts on its own, since the price movement
is a non-stationary random process and, therefore,
cannot be predicted. However, it provides a dynamic and very
reliable estimate of the current price movement.
By using the above mentioned calculations APMP shows the real current price trend.
What does a real trend mean? And what’s wrong with the other indicators? Really
they don’t show the real trend? We are used to determining the current trend
using classic indicators, such as moving averages, bands
Either by drawing a line (or two parallel lines) between two or more extremes.
Of course, these traditional indicators and drawing methods
are still relevant and popular among traders, but can they
bring a stable profit? Unlike abstract methods, we are
endowed with intuition. This indicator will allow you to improve or fix
your trading system, or completely abandon it, because,
as you will see for yourself, even the most chaotic behavior to which
The price movement also applies, it is subject to large numbers and is limited by
mathematical laws.
Basically, APMP is used in the same way as normal trend lines, as
well as support and resistance lines. The fundamental difference is in the
reliability and stability of the values calculated by the indicator.
A typical use of APMP looks like this:
When trading on a trend, traders buy near the support line
in an uptrend and sell near the resistance line in
a downtrend.
In a correction-based trading strategy (countertrend
trading), traders buy near the support line in
a downtrend and sell near the resistance line in an uptrend.
Note that significant levels can play a role as
both the support level and the resistance level. It is necessary to keep this in
mind when developing your trading strategy and pay special attention to
the behavior of the price when it approaches this level.
The stop loss can be located at a distance from the opening price equal to
the distance between the support and resistance levels, while the take
profit can be set twice as far away. It would also be
wise to use a trailing stop to move the stop loss when
the movement of support and resistance levels favors your
position.
The strategy outlined above is just a framework.
However, APMP provides enough information to develop a
variety of trading strategies and improve existing ones.
It would be interesting to hear about the various strategies created based on this indicator.
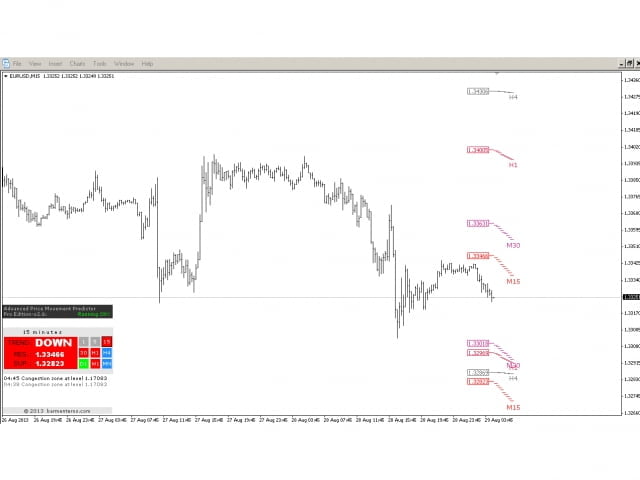
APMP displays the following information:
- The support and resistance levels closest to the market price for the current and larger timeframes.
- The real trend and the most likely short-term movement on the current and larger timeframes.
- Alerts when bottlenecks appear, as well as when the price crosses
any important levels. Bottlenecks are defined as intersection points
two or more levels.
Users can also enable the dialog box and
email alerts. Notifications of the APMP indicator, as well as the terminal itself
MetaTrader is accompanied by sound signals. In addition, all
alerts are saved in the “Experts” tab for further analysis.
a particular symbol, as well as for long-term use, processing
all data from different timeframes can take up to one minute,
so we recommend updating all periods for the symbol (s), to
to which you are going to apply this indicator to ensure the
normal operation of APMP from the very beginning.
We are a small team of developers / traders who provide
professional services for the development of applications in the field of trading in
mainly for the MetaTrader platform.
Our team members have an average of 7 years of trading experience
, and about 6 years of programming experience for MetaTrader. We develop scripts, indicators and trading
advisors for many clients from all over the world, as well as for our own
needs, as was the case with the Advanced Price Movement indicator
Predictor (APMP).
[/spoiler]