


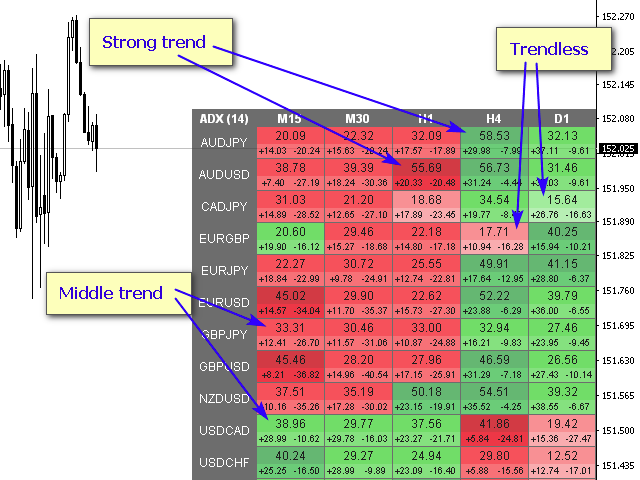

The ADX indicator is used to determine the trend and its strength. The direction of the price is shown by the values DI and -DI, and the value of ADX shows the strength of the trend. If DI is above -DI, then there is an uptrend in the market, if on the contrary, then a downtrend. If the ADX is below 20, then there is no definite movement in the market. As soon as the indicator breaks through this level, an average trend begins. Values above 40 indicate the presence of a strong trend, whether descending or ascending.
Multi-currency and multi-time frame indicator ADX (Average Directional Movement Index). In the parameters, you can specify any desired currencies and timeframes. The indicator can also send notifications when the trend strength levels intersect, and when the DI and -DI lines intersect. By clicking on the cell with the period, this symbol and period will be opened.
Parameters
ADX Period — averaging period;
ADX Applied Price — the price used;
Clear the chart at startup – clear the chart at startup;
Set of Pairs — a set of characters
– Market Watch – pairs from the “Market Overview” window;
– Specified manually – the pairs specified manually in the “Pairs” parameters;
[spoiler title=”Read More…”]
– Current pair – show only the current pair.
Pairs (separated by a space or semicolon) – a list of characters separated by a space or semicolon. Currency names should be written exactly the same as the broker’s, keeping the case and prefix suffix;
Time Frames (separated by a space or semicolon) – a list of timeframes separated by a space or semicolon;
Sort pairs – sorting the list of characters;
Position on chart — the angle of the panel on the chart;
X offset (pix) – move the panel along the X axis;
Y offset (pix) – move the panel along the Y axis;
Allow to move the table manually – allow moving the table with the mouse;
Refresh dashboard every (seconds) – the refresh period of all symbols and timeframes;
Refresh cells only on new bar – the cell (and alerts) will be updated only when a new bar appears;
Open the pair in a new window — open a new window for the chart by clicking;
Chart template — the name of the template for the chart, if the chart opens in a new window.
Color settings
Color Up Strong trend — cell color if there is a strong trend;
Color Up Middle trend — the color of the cell, if the average trend;
Color Up Trendless — the color of the cell if there is no trend;
Color Down Strong trend — cell color if there is a strong trend;
Color Down Middle trend — the color of the cell, if the average trend;
Color Down Trendless — the color of the cell if there is no trend;
Transparency (0-255) – transparency of the panel;
Font name — font name;
Font size ADX – font size;
Font size DI (0-off) — font size;
Alerts
Timeframes for alerts —separated by a space or semicolon) – a list of periods for which an alert will be sent (separated by a space or semicolon).
Strong trend >= >— strong trend level;
Middle trend >=> — the level of the average trend;
Check alerts only on bar closing – check the intersection of levels only after the bar is closed;
Strong trend level is crossed Up – alert when ADX crosses the level of a strong upward trend;
Strong trend level is crossed Down – alert when ADX crosses the level of a strong down trend;
Middle trend level is crossed Up – alert when the level of the average trend is crossed up;
Middle trend level is crossed Down – alert when the level of the average trend is crossed down;
DI line crosses the DI- line Up – alert when DI crosses DI- up;
DI line crosses the DI- line Down – alert when DI crosses DI- down;
All timeframes in the same direction – alert when all cells show the same direction;
Pop up alert – pop-up alert;
Push notifications – push notification;
E-mail notifications – email notification;
Sound alert — sound alert only.
[/spoiler]