


A revolutionary new way to determine the beginning of a trend early using the methods of the popular ADX indicator. The new system adapts to the market, eliminates additional conditions and copes with its task.
When using the classic ADX indicator, to get a signal confirmation, it is necessary that the ADX line crosses a certain level 20, 22, 26, etc.It is extremely difficult to choose this level not only for different instruments, but also for different periods of the same chart. Unfortunately, this makes the ingenious ADX indicator almost useless.
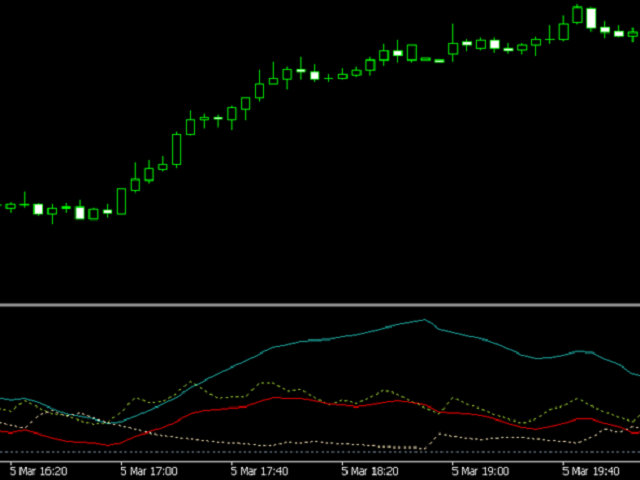
The solution turned out to be simple, but at the same time conceptual. In the new indicator, we abandon this level altogether. To determine the trend, a new line is calculated, which at the intersection of DI from the bottom up gives a sell signal, and at the intersection of-DI from the bottom up gives a buy signal. And at the reverse intersection, it gives a signal for the end of the trend.
The signal line has a sensitivity parameter. The higher its value, the higher the market noise filter on instruments with high volatility. The lower this parameter, the more accurate the signal is. Recommended values are from 5 to 10 (default is 6).
As a bonus, the new indicator has a choice of displaying information from any standard timeframe.
[spoiler title=”Read More…”]
- Timeframe of ADX (0-current) – the timeframe from which the data for the indicator is taken
- ADX period – the period of the ADX indicator
- Applied price (close, open, etc.) – the type of price to which the indicator will be applied
- Sensitivity of signal line – sensitivity of the signal line (optimal 5-10)
- Averaging method – method for smoothing the signal line
[/spoiler]