


Harmonic patterns are feature price movements in light of the Fibonacci levels that mathematically precede price reversals. This index recognizes 26 classical and non-classical harmonic patterns:
The indicator recognizes both completed patterns and incomplete prospective patterns.
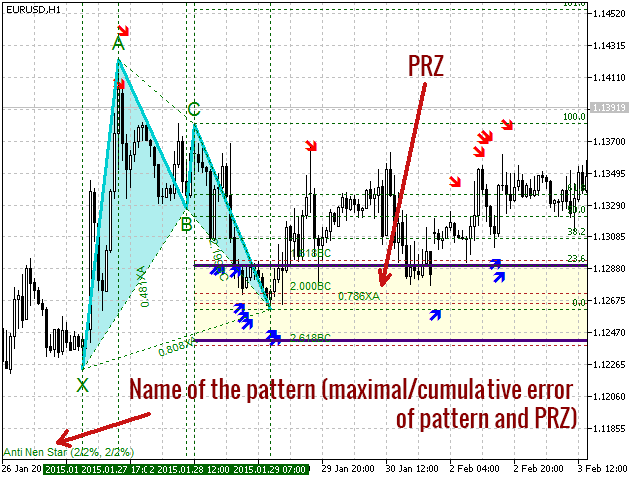
- A possible harmonic pattern is formed when the points X, A, B, and C of the pattern are already formed, but the price has not yet entered the potential reversal zone (PRZ).
- A completed (pending) harmonic pattern is formed when the current bar has already closed and the price is inside the PRZ.
The indicator recognizes all possible alternatives. That is, you can view all potential and completed patterns on a given bar. Quite often there is a situation when several possible patterns are formed on one bar – you can see them all!
Scrolling between the patterns can be done from the keyboardor from the panelon the chart of the currency pair. The following parameters regulate these features:
- Use keyboard to control the indicator: If set to true, then you can scroll patterns from the keyboard (English keyboard layout): W – switch between the patterns of the current bar and the historical, A, and D – previous/next pattern, S – on/off the PRZ, Q – enable/disable color filling pattern, E – enable/disable color filling the PRZ.
- Use dashboard to control the indicator: If true, a panel with the same functionality as described above for the keyboard is displayed.
[spoiler title=”Read More…”]
You can control the accuracy of the patterns by using the following parameters:
- Compression rate: The percentage of price data compression. The larger this parameter, the fewer price extremes are filtered out, but the remaining extremes are stronger. The compression is based on the Important Extrema indicator. The documentation for this indicator can be found here.
- Update compression parameters periodically: Enables periodic updates of compression parameters. The compression parameters are determined from historical data. As new data arrives, they may need to be updated.
- Update period (in bars) of compression parameters: How often the compression parameters are updated.
- Length of data (in bars) for compression update: The size of the historical data segment to update the compression parameters.
- Pattern length (in bars): The average length of the analyzed harmonic patterns.
- Pattern length delta: The deviation of the length of the patterns from the average length. For example, if we are looking for patterns with a length of 100 bars with a deviation of 0.1, the indicator will find patterns with a length of 90 to 110 bars.
- Do not allow price to go above/below XB: Do not allow price to cross the XB line.
- Do not allow price to go above/below AC: same as for AC.
- Do not allow price to go above/below BD: Similar for BD.
- Do not allow price to go above/below XD (for some patterns): Similarly for XD.
- Pattern tolerance (in percent of XABC height): The absolute error at points X, A, B, and C, measured as a fraction of the total height of the XABC pattern. When this value is close to zero, fewer patterns will be found, but they will be more accurate.
- PRZ tolerance (in percent of XABC height): The absolute error in the levels that make up the PRZ, measured as a fraction of the total height of the XABC pattern. The smaller this value, the narrower the PRZ will be, and correspondingly fewer patterns will be found.
List of buffers:
0: Buy Signal
1: Sell Signal
2: Price at point X
3: the Price at point A
4: the Price at point B
5: Price at point C
6: the Price at point D
7: Lower price of PRZ
8: Top PRZ price
9: the index of the point X
10: Index of point A
11: the Index of point B
12: the index of the point C
13: Index of point D
[/spoiler]