


Traders use pivot points (pivots) to objectively determine potential support and resistance levels.
Pivots can be extremely useful when trading in the Forex market, as currency pairs tend to fluctuate between these levels. Most of the time, the price fluctuates between the R1 and S1 levels.
Pivot points can be used by traders who trade in a range, as well as by breakouts and trends.
When using range trading, traders open a buy order near the identified support levels and a sell order when the price approaches the resistance level.
However, there are several methods for determining pivot points.
However, there are several methods for determining pivot points.
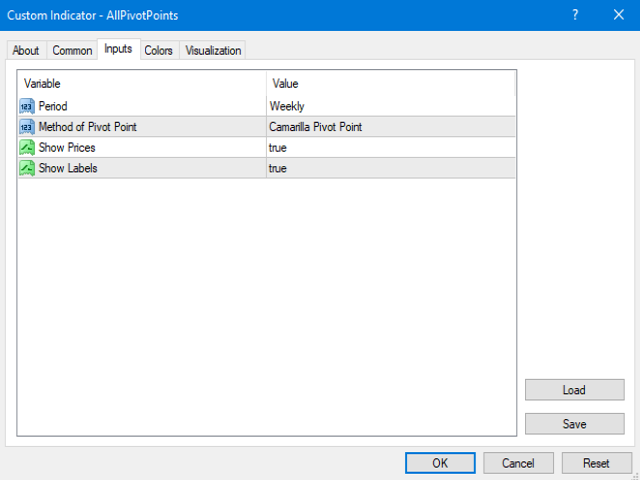
This indicator allows you to see the lines of all pivots for all methods, as well as to see daily, weekly and monthly pivots.
- Standard pivots
- Fibonacci Pivots
- Demark Pivots
- Camarilla Pivots
- Woody’s Pivots
- Pivots of Frank Dilernia (Frank Dilernia)
- ShadowTrader Pivots
- Central Pivot Range
In the indicator settings, you can choose how the type is displayed on the chart and for what period (daily, weekly, monthly)
In fact, as with all varieties of any other indicators, there is definitely no better method. It all depends on combining your knowledge of pivot points with the other tools in your Forex trading kit.
[spoiler title=”Read More…”]
Keep in mind that most automatic calculation and plotting programs usually use the standard method when plotting pivots.
But now, with the help of this indicator, you will be able to see these levels for yourself, you will be able to try them all out and find the most suitable one for you. Now it’s easy to work with pivots!
- Period – the period for the calculation (day/week/month).
- Method of Pivot Point – method for calculating pivot points.
[/spoiler]