


The indicator detects support/resistance lines on three timeframes simultaneously:
- one TF lower;
- on the current TF;
- one TF higher.
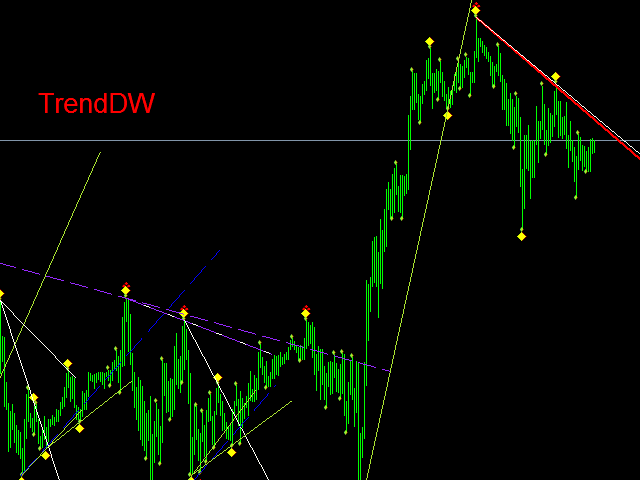
In addition to the support/resistance lines, the indicator determines the reversal points (wave peaks):
- red dots – peaks on the lowest timeframe;
- the yellow dots represent the peaks on the current timeframe.
- Show trend line – Whether to show the main trend line
- Main Trend Line Color – The color of the trend line;
- Show trend text – Text of the trend direction;
- Resistance High line color – The color of the resistance lines of the lowest TF;
- Support High line color – The color of the upper support lines of the lower TF;
- Resistance Low line color – The color of the resistance lines of the current and higher TF;
- Support Low line color – The color of the support lines of the current and higher TF;
- Alarm wave peaks-Alert when forming a pivot point.