


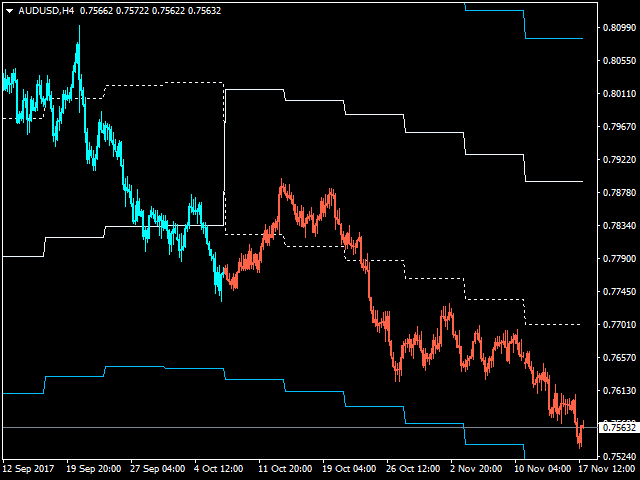

The indicator shows the main trend on the current chart.
- The indicator includes two pairs of bars: the first-internal white bars, the second-external blue bars.
- If the white dotted line crosses the white solid line down, it means that the trend is changing to bearish.
- If the white dotted line crosses the white solid line up, it means that the trend is changing to bullish.
- After the intersection occurs, the indicator is not redrawn.
- ShowColorCandle: If true, the candles will be colored.
- BullColor: the color of the candle in the bull market (by default – clrAqua).
- BearColor: the color of the bear market candle (clrTomato by default).
Enter the market when the price is within the inner bands. If the price reaches the outer bands, the order must be closed.
The key to successful trading is to choose the right timeframe. Of course, you can use this indicator to create your own strategy.