


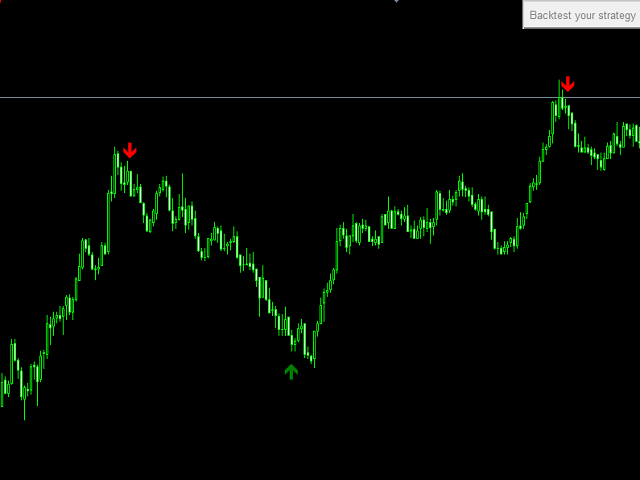

The indicator Χ15 for MetaTrader 4 allows you to quickly, easily and efficiently build and test strategies in real time. It includes 15 of the most popular technical indicators that you can use in various ways. Select the indicators and specify how to use them – after that, buy (green) and sell (red) signals will be displayed on the chart with arrows according to the strategy you have chosen. Select the take profit and stop loss levels, and the indicator will show the results of your strategy with full history testing statistics on all candlesticks of the selected chart.
All indicators are fully customizable by the user.
All indicators are available in the standard delivery of MetaTrader 4, so there is no need to install anything additional.
Indicators:
- Two moving averages, one fast, the other slow. You can use slow, fast, or both.
- RSI with overbought and oversold levels, the RSI range and finding the RSI above/below the critical value.
- ADX – ADX level, ADX trend, DI and –DI or all together.
- Stochastic – the range of values of the stochastic or critical level.
- MACD – above/below zero, above/below the signal line, or both.
- Volume indicator Volume – above/below the level, volume above /below the moving average on the volume indicator, both options.
- Bollinger Bands – the range between the upper and lower bands or the middle band.
- Heiken Ashi – by color Heiken Ashi.
- CCI – overbought/oversold levels by CCI, CCI above/below the level.
- Momentum – direction.
- OSMA – above/below zero, OSMA direction, both options.
- Parabolic SAR – above/below the level.
- Accelerator – above/below zero, Accelerator direction, both options.
- ATR – ATR direction.
- Ichimoku – Chikou, Kumo, Kijun and Tenkan
[spoiler title=”Read More…”]
- ArrowDistance – the distance in pips between the indicator arrows and the bar;
- BullishColor – bullish arrow color (for purchase);
- BearishColor – bearish arrow color (for sale);
- fontSize – font size for the test results on the chart;
- textColor – the color of the text of the test results on the graph;
- RSIOn – true = include the RSI indicator in the strategy;
- RSIPeriod – RSI period;
- RSIStrategyType – type of strategy;
- RSI_OVERBOUGHT_OVERSOLD means to buy when the RSI is below the overbought level of the RSI, and to sell when the RSI is above the oversold level of the RSI.
- RSI_VALUE_RANGE means to buy when the RSI is between the overbought and oversold levels of the RSI.
- RSI_VALUE_UP_DOWN – buy when the RSI is above the critical level, and sell when the RSI is below the critical level.
- RSIOverboughtLevel – the overbought level of the RSI;
- RSIOversoldLevel – the oversold level of the RSI;
- RSICriticalValue – the critical level of the RSI.
- RSI_OVERBOUGHT_OVERSOLD means to buy when the RSI is below the overbought level of the RSI, and to sell when the RSI is above the oversold level of the RSI.
- RSI_VALUE_RANGE means to buy when the RSI is between the overbought and oversold levels of the RSI.
- RSI_VALUE_UP_DOWN – buy when the RSI is above the critical level, and sell when the RSI is below the critical level.
[/spoiler]