


The indicator is a complete trading system. It identifies all the main market conditions (trend, pullback in trend, flat), which allows you to enter the market at any time and use any methods and styles of trading.
There is no need to write how the indicator works, everything is clear from its settings. Only the CCI is calculated from the smoothed price range.
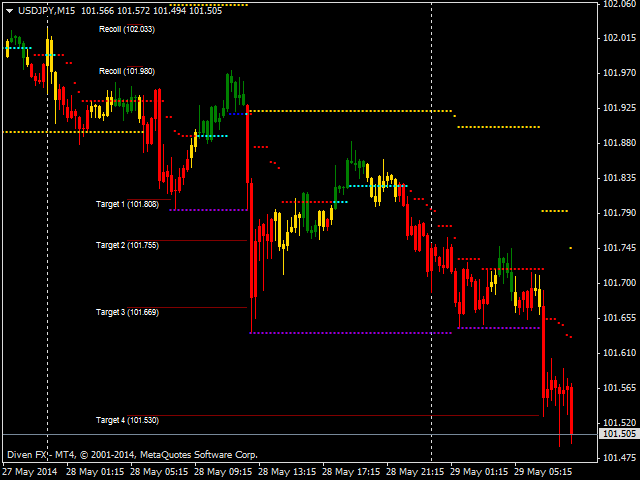
It has two main rows of points, one additional row, and target levels in the form of lines. It is possible to color the candles depending on the position of the fastCCI, but this is not necessary (it is disabled), it is rather informational in nature and depends on the preferences of the trader, as well as the timer of the remaining time until the candle closes.
The first row of yellow dots shows the direction of the global trend. If they are located below the price, then the trend is “bullish”, if above the price – then “bearish”. It also serves to set a “hard” stop at the moment of entering the market according to the trend and its movement with a conservative trading style. When trading against a trend, their position determines the target level. It is plotted as a percentage of the reached extremes (by Close or High-Low to choose from). It changes in the settings and requires selection depending on the type of market (FOREX, stock, commodity, volatility) or the trader’s preferences (risks, style, etc.).
[spoiler title=”Read More…”]
It is very simple to do this, just install the indicator on the chart of the instrument and, going through the Fibonacci numbers (preferably), visually assess the position of the yellow dots relative to the price and your preferences. I especially want to note such an advantage of the indicator as the fact that the location of the main levels (global trend, target levels) IT DOES NOT DEPEND on the chart period for intraday trading (“drawSlow-HIGH_LOW”). That is, their readings, that on M1, that on H4, will be unchanged, the same can be said about the charts above the daily one. If “drawSlow-CLOSE”, then the differences will be insignificant, this is due to the fact that the minimum (maximum) closing price of the candles on H1 and M15 may differ. But they are not so significant.
The second main row of dots has three colors: red, blue, and light blue. Red indicates a bearish trend in the market, blue indicates a bullish trend, and blue indicates uncertainty or flat. This signal is formed from two criteria: the direction of the market movement (decreasing-increasing price range) and the position of the slow CCI below, above or between certain levels. The period and level are changed in the settings. If there are discrepancies between the price direction and the CCI readings, the price movement is preferred. That is, if the CSI is between the levels of “FletLevel” (the zone of uncertainty in the market), and the price continues to rise, the color of the dots will be blue and will change to blue only when the next maximum is not reached.
Similarly for a downtrend. The position of the points on the chart determines the maximum (minimum) of the bar and the value of the ATR indicator(5). Their price value can be used for trailing the stop (moving the stop to the price value of the point of the previous candle). Method
calculation and construction makes it one of the varieties of the ” Moving Average with
Dynamic Averaging Period ” with an additional CCI filter.
Therefore, when trading, it is necessary to take into account the rules applicable to
this instrument.
Target levels are based on the Fibonacci numbers, and their set can be changed in the settings by writing “;” without spaces and preferably in ascending order, so that there is no confusion with their description (so that the level in 138.2 will be No. 5, and 261.8-under No. 1). For the same reason, it is better to write the correction levels at the very end of the list. The lines that mark the levels continue on the screen until they are worked out or there is a change in the global trend.
An additional row of purple dots appears when the main row (yellow dots) moves without changing its price level for a certain number of bars, and is based on the price maximum (minimum) reached during this period. Thus, a price channel is formed, within the boundaries of which a correction or a sideways movement (flat) occurs. It is convenient when trading against the trend or pipping.
If the candles are colored red, the quick CCI is below “- CCiLevel”. Green indicates that the fast CCI is located above the “CCiLevel”, and yellow indicates the location in between. The fast CCI period, CCiLevel and the number of bars are changed in the settings.
- fiboK – distance to the main line (yellow dots) in Fibonacci numbers.
- drawSlow – at what prices to build trend lines (yellow dots).
- targetFiboLevel – a set of Fibonacci levels for determining target levels.
- LevelStyle – the style of the lines of the target levels.
- LevelWidth – the thickness of the lines of the target levels.
- slowCCiPeriod – the period of slow CCI for determining the market trend (the color of the second main set of points depends on it).
- fastCCiPeriod – the period of fast CCI (affects the color of candles).
- FletLevel – levels between which the position of the slow CCI ( ” ” ,” -“) is considered a state of uncertainty in the market.
- CCiLevel – the levels between which the position of the fast CCI ( ” ” ,” -“) is considered a state of uncertainty in the market.
- candleCCI-enables the function of coloring bars depending on the position of the quick CCI. With “BARS” or “CANDLES”, the price chart is automatically moved to the background.
- candleBack – colored candles in the background.
- CCIPrice-price selection for calculating the price range (used for calculating CCI).
- barFlet – the number of bars after which a correction or flat is considered to have started (the yellow dots move sideways).
- totalFastCCIbar – the number of bars to be colored.
- AutoScale-autoscaling of points and candlesticks.
- sizeArrow-the size of the points (AutoScale= = false).
- font_size – the text size of the target levels.
- text_color – the text color of the target levels.
- AlertON-a signal of a change in the global trend.
- EmailON-sending a message to an email.
- clockVisibility – visibility of the timer for counting down the time until the candle closes.
- secondsToBarClose – the number of seconds remaining before the candle closes, when the signal is reached.
- timeColor – the color of the timer.
- font_sizeClock – the font size of the timer.
- clockAlertON-disables the timer signal.
- soundAlarm – the name of the *.wav file that will be played when “clockAlertON=true”.
[/spoiler]