


The Aroon Indicator technical indicator displays the current trend, its strength and the probability of a reversal or flat.
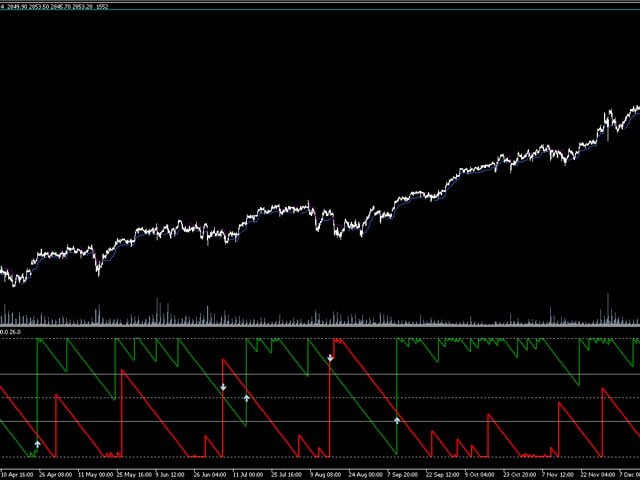
It consists of two lines-Aroon Bullish Line (bullish) and Aroon Bearish Line (bearish).
The bullish line is calculated as (the number of bars in the period – the number of bars since the highest peak in the period)/the number of bars in the period in %. The bearish line is calculated similarly from the moment of the deepest low. Both lines are displayed on the same chart and are in the range from 0 to 100. A value of about 100 indicates the strength of the trend in the corresponding direction, a value of about 0 indicates the weakness of the trend in this direction. For example, in an actively growing market, the bullish line will approach 100, and the bearish line will approach 0. In a falling market, the situation is reversed.
If you are working with the indicator to pay attention to the following:
- The position of the indicator relative to the key levels, 30 and 70 – a movement above 70 indicates a strong trend, a movement below 30 indicates a weak trend. Movements between 30 and 70 indicate indecision. For example, if a bullish indicator stays above 70 while a bearish indicator stays below 30, the trend is definitely bullish.
- Indicator intersections confirm the trend if they occur between levels 30 and 70. For example, if a bullish indicator crosses a bearish one from the bottom up, it confirms the bullish trend.
[spoiler title=”Read More…”]
From the two indicators, you can make an oscillator – the difference between the bullish and bearish lines. The oscillator ranges between 100 and -100.
It is a bit simpler, but provides less information. Key levels: 50, 0 and -50. If the oscillator moves above 50, it indicates a strong bullish trend. With fluctuations around 0, there is no trend. Finally, a move below -50 indicates a strong bearish trend.
- Number of Bars Used for Calculation – the length of the calculation period. The higher the value, the larger the trend segment measured by the indicator. Thus, depending on the timeframe of the chart and the number of bars, the indicator can measure very long-term trends up to intraday ones. The default value is 25 bars.
- Show Indicator Crossover Arrows-add arrows to the chart when the bullish and bearish lines intersect, indicating the ascending or descending nature of such an intersection. Intersections in the 30-70 range are the most important and can indicate changes in the trend. This option is enabled by default. The arrows are not displayed on the oscillator chart.
- Show Oscillator Instead of Indicators – if true, an oscillator without arrows is displayed instead of two indicators. By default, it is false.
[/spoiler]