


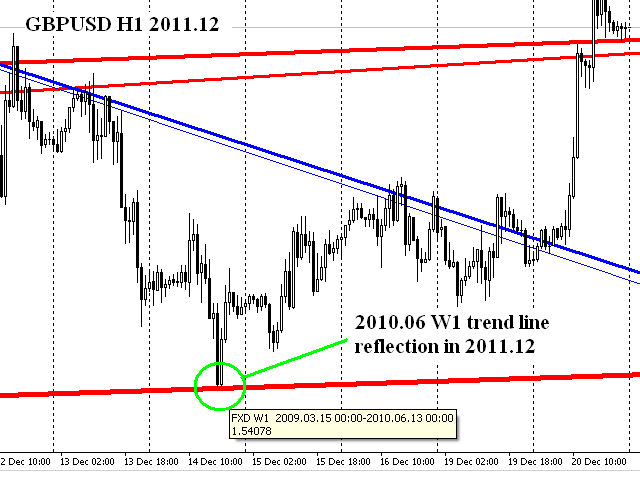

The Ashot Trend Lines indicator automatically creates trend lines for the current timeframe and all higher timeframes on the current chart.
The lines are drawn through successive strong price impulses detected by a special technique.
High-scale lines predict possible support and resistance, while a stack of lines shows the current trend.
The line thickness depends on the timeframe.
- History – the number of history bars analyzed in each timeframe. Recommended value: 1000-2500
- DemandColor-color of the AT-demand line
- SupplyColor – the color of the AT-line of the offer
- DemandDeadColor – color of the dead demand AT-line
- SupplyDeadColor – the color of the dead AT-line of the offer
- ShowHLines-display resistance levels as horizontal lines
- DemandHColor – color of demand levels
- SupplyHColor – the color of the offer levels
- ShowTDLinesLevel3-display TD lines of scale three timeframes higher than the current one