


The indicator shows price reversals with a high degree of accuracy. Reversals are displayed on the chart as arrows and are not redrawn. The indicator is based on the price and volume algorithms developed by us. This powerful tool increases the effectiveness of your trading. Easily configurable parameters and the accuracy class for each of them give the product the flexibility to adapt to market conditions.
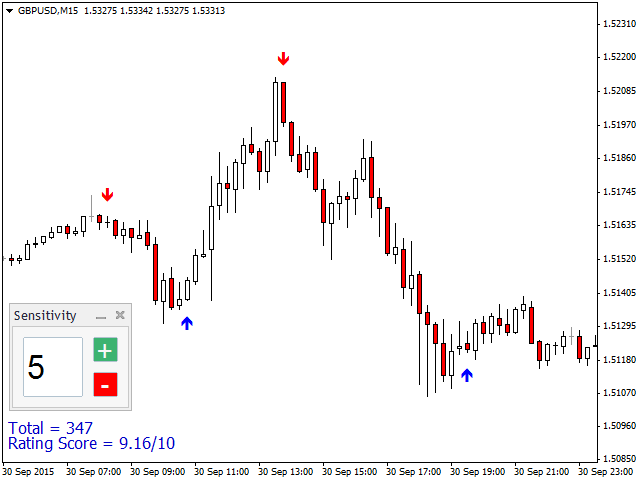
The indicator has a user-friendly interface with customizable sensitivity to price reversals. Built-in statistics show the accuracy (Rating Score) and frequency (Total) of the selected sensitivity level, and you can quickly select the optimal level for the current chart. Thanks to its versatility and careful optimization, the Expert Advisor can work on any timeframe (M1-MN1) on both trend and flat markets. It should be used as part of a trading system for greater efficiency.
DEMO: Before changing the sensitivity, do not forget to pause the tester.
DEMO: Before changing the sensitivity, do not forget to pause the tester.
- Accurately determines price reversals
- Does not redraw
- Reversals are displayed at the close of the bar
- Adapts to the selected symbol and timeframe
- Preliminary optimization is carried out for all timeframes based on well-thought-out statistical methods
- Built-in alerts (via email/as push notifications)
[spoiler title=”Read More…”]
The settings are mainly intended for customizing the text and managing alerts. The most important setting, sensitivity, directly affects reversals and can be changed directly on the chart. The sensitivity value set on any chart is saved by the indicator for future use.
Rating Score allows you to quickly select the most optimal sensitivity value for the current chart. The rating is calculated as the ratio of successful reversals (the candle following the one on which the reversal occurred closes higher when the reversal is up) to their total number in the range of 0-10. Given the calculation methodology, lower sensitivity values usually have a higher rating and vice versa. The table below will help you determine the best rating for each sensitivity value. A good rating, confirmed visually using the latest price action, allows you to make sure that the indicator is properly optimized for the current market conditions.
To select the best sensitivity value:
- Zoom in on the graph and visually find the right candidate
- Make sure that the rating of the sensitivity selected in 1) exceeds the minimum rating in the table below. If this is not the case, continue searching.
To select the best sensitivity value:
Total Number – the number of reversals on the chart. For scalping, it should be quite large, whereas with swing trading, you can afford fewer reversals with a higher rating.
[/spoiler]