


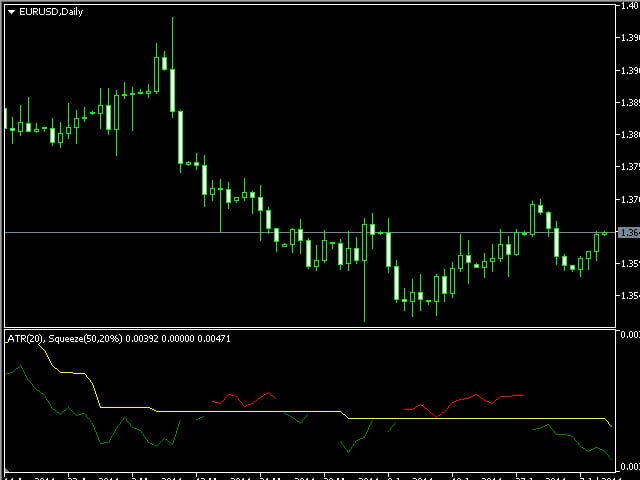

The indicator allows you to configure your own compression criteria for the ATR indicator, which shows reduced volatility during compression and high volatility. This indicator shows the ATR line as well as the compression or threshold line equal to the lowest ATR value plus the percentage you set. The compression line is yellow. The ATR line below the compression line is green, and the ATR line above the compression line is red. After calculating the compression line, you can use this indicator to determine the possible start of a trend price movement with increasing volatility. Use this indicator in conjunction with the free ATR Envelopes indicator to track ATR compression and expansion as volatility changes.
You can change the number of bars used in the ATR, the number of history bars to calculate the lowest ATR value on those bars, and the percentage above the lowest ATR value to display a line allowing you to easily see when the ATR rises above your set compression threshold. Input parameters:
- ATR_Periods: The number of bars to calculate the ATR.
- Bars_Back: The number of bars on the history to calculate the minimum ATR value.
- Threshold_Percent: The percentage to add to the minimum ATR value. If you need to set the threshold line to 20% above the minimum ATR value, specify 20 here.
[spoiler title=”Read More…”]
Calculating the ATR compression line/Threshold line:
[/spoiler]