


Just drag the indicator to the chart and the support and resistance levels will be plotted automatically!
An indicator for automatically plotting support and resistance lines at THREE points.
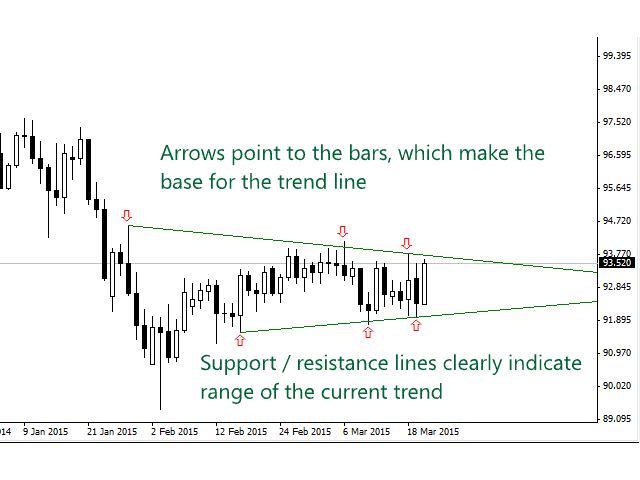
- The found points are marked on the graph.
- The indicator also shows the breakout price for both the uptrend and downtrend (if found).
- You can specify how many previous bars the indicator should check to find the reference points.
Additionally, you can choose which time range the indicator will work on. That is, when using the H1 chart, you can see the trend and breakout points from H4.
Contact the author if you have any suggestions for improving the indicator.