


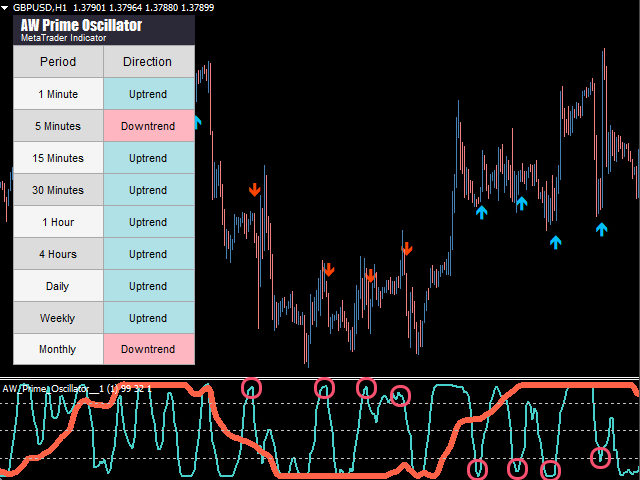

A combination of two oscillators. The first one shows the entry points, the second one shows the current trend. The indicator can display oscillator signals with arrows in two modes, all signals of a fast oscillator or signals only for the current trend. It has a multi-time frame panel and three types of notifications about the appearance of a signal.
Advantages:
- Suitable for day and scalping trading
- Trend filtering
- Simple and sensitive setup
- Multi-time frame panel
- Suitable for integration into the Expert Advisor.
- It works on any symbols and any timeframes
- Three types of notifications
Indicator Strategy
The indicator consists of two different oscillators:
- Slow trend line (thick) – when the upper horizontal level (High level of indicator) crosses from top to bottom, it is an indicator of a downward trend, when the lower horizontal level (Low level of indicator) crosses from bottom to top, it is an indicator of an upward trend. In addition, finding a slow line in the lower zone indicates that the current trend is downward and vice versa, finding a slow line above the upper level shows that the current trend is upward. This is how the indicator determines the current market trend.
- Fast line of inputs (thin): determines the entry points at the intersection of the bottom line from bottom to top, these are buy signals, at the intersection of the top line from top to bottom, this is a sell signal. It is important to adjust the indicator lines in addition to the oscillator lines, as this affects the number and accuracy of signals.
In the product, different oscillators are used to display the slow and fast lines, each must be adjusted separately.
For ease of operation, the indicator shows the trend directions in the multi-time frame panel, and puts the inputs on the chart in the form of arrows. We have also added notifications for incoming imndicator signals.
Input variables
MAIN SETTINGS
- High level of indicator – adjustment of the upper horizontal line of the indicator
- Middle level of indicator – adjustment of the middle horizontal line
- Low level of indicator – adjusting the level of the lower horizontal line
- Signal strategy – setting up arrows when signals appear
- Fast oscillation signal – arrows will appear on the signal of a fast oscillator, without taking into account the current trend
- Signal by current trend – arrows will be displayed according to the signal of the fast indicator, taking into account the slow oscillator (current trend)
FAST OSCILLATOR
- Fast oscillator period – setting the period of the fast line, the longer the period, the slower the line will be
- Fast oscillator smooth – adjust the smoothing of the oscillator line, the greater the smoothing, the smoother the line
SLOW OSCILLATOR
- Slow MA period – setting the moving average, the longer the period, the smoother the signals
- Slow oscillator period – adjusting the period of the slow oscillator, the longer the period, the slower the line
- Slow oscillator smooth – adjusting the smoothing of the oscillator line, the greater the smoothing, the smoother the line
NOTIFICATIONS SETTINGS
- Send Push Notifications – Use notifications about the appearance of new signals on the mobile version of the terminal
- Send Email – Use sending emails about the appearance of signals by email
- Send Pop Up Alerts – Send alerts about the appearance of new signals
GRAPHICS SETTINGS
- Create Arrows – show or hide arrows
- Multitimeframe dashboard – in the panel display id, minimized or full
- Font size in panel – the size of the text on the indicator panel
- Y offset – moving the panel along the Y axis
- X offset – moving the panel along the X axis
- Fast line color – the color of the fast line of the oscillator
- Slow line color – the color of the slow line of the oscillator
- Up arrow color – the color of the arrows at the signal to buy
- Down arrow color – the color of the arrows at the signal to sell
- Uptrend color Panel – the color of the downtrend in the panel
- Downtrend color Panel – the color of the uptrend in the panel
- Uptrend text color – the color of the text in the panel in an uptrend (for a minimized panel)
- Downtrend text color – the color of the text in the panel in a downtrend (for a minimized panel)
[spoiler title=”Read More…”]
A combination of two oscillators. The first one shows the entry points, the second one shows the current trend. The indicator can display oscillator signals with arrows in two modes, all signals of a fast oscillator or signals only for the current trend. It has a multi-time frame panel and three types of notifications about the appearance of a signal.
Advantages:
- Suitable for day and scalping trading
- Trend filtering
- Simple and sensitive setup
- Multi-time frame panel
- Suitable for integration into the Expert Advisor.
- It works on any symbols and any timeframes
- Three types of notifications
Indicator Strategy
The indicator consists of two different oscillators:
- Slow trend line (thick) – when the upper horizontal level (High level of indicator) crosses from top to bottom, it is an indicator of a downward trend, when the lower horizontal level (Low level of indicator) crosses from bottom to top, it is an indicator of an upward trend. In addition, finding a slow line in the lower zone indicates that the current trend is downward and vice versa, finding a slow line above the upper level shows that the current trend is upward. This is how the indicator determines the current market trend.
- Fast line of inputs (thin): determines the entry points at the intersection of the bottom line from bottom to top, these are buy signals, at the intersection of the top line from top to bottom, this is a sell signal. It is important to adjust the indicator lines in addition to the oscillator lines, as this affects the number and accuracy of signals.
In the product, different oscillators are used to display the slow and fast lines, each must be adjusted separately.
For ease of operation, the indicator shows the trend directions in the multi-time frame panel, and puts the inputs on the chart in the form of arrows. We have also added notifications for incoming imndicator signals.
Input variables
MAIN SETTINGS
- High level of indicator – adjustment of the upper horizontal line of the indicator
- Middle level of indicator – adjustment of the middle horizontal line
- Low level of indicator – adjusting the level of the lower horizontal line
- Signal strategy – setting up arrows when signals appear
- Fast oscillation signal – arrows will appear on the signal of a fast oscillator, without taking into account the current trend
- Signal by current trend – arrows will be displayed according to the signal of the fast indicator, taking into account the slow oscillator (current trend)
FAST OSCILLATOR
- Fast oscillator period – setting the period of the fast line, the longer the period, the slower the line will be
- Fast oscillator smooth – adjust the smoothing of the oscillator line, the greater the smoothing, the smoother the line
SLOW OSCILLATOR
- Slow MA period – setting the moving average, the longer the period, the smoother the signals
- Slow oscillator period – adjusting the period of the slow oscillator, the longer the period, the slower the line
- Slow oscillator smooth – adjusting the smoothing of the oscillator line, the greater the smoothing, the smoother the line
NOTIFICATIONS SETTINGS
- Send Push Notifications – Use notifications about the appearance of new signals on the mobile version of the terminal
- Send Email – Use sending emails about the appearance of signals by email
- Send Pop Up Alerts – Send alerts about the appearance of new signals
GRAPHICS SETTINGS
- Create Arrows – show or hide arrows
- Multitimeframe dashboard – in the panel display id, minimized or full
- Font size in panel – the size of the text on the indicator panel
- Y offset – moving the panel along the Y axis
- X offset – moving the panel along the X axis
- Fast line color – the color of the fast line of the oscillator
- Slow line color – the color of the slow line of the oscillator
- Up arrow color – the color of the arrows at the signal to buy
- Down arrow color – the color of the arrows at the signal to sell
- Uptrend color Panel – the color of the downtrend in the panel
- Downtrend color Panel – the color of the uptrend in the panel
- Uptrend text color – the color of the text in the panel in an uptrend (for a minimized panel)
- Downtrend text color – the color of the text in the panel in a downtrend (for a minimized panel)
A combination of two oscillators. The first one shows the entry points, the second one shows the current trend. The indicator can display oscillator signals with arrows in two modes, all signals of a fast oscillator or signals only for the current trend. It has a multi-time frame panel and three types of notifications about the appearance of a signal.
- Suitable for day and scalping trading
- Trend filtering
- Simple and sensitive setup
- Multi-time frame panel
- Suitable for integration into the Expert Advisor.
- It works on any symbols and any timeframes
- Three types of notifications
The indicator consists of two different oscillators:
- Slow trend line (thick) – when the upper horizontal level (High level of indicator) crosses from top to bottom, it is an indicator of a downward trend, when the lower horizontal level (Low level of indicator) crosses from bottom to top, it is an indicator of an upward trend. In addition, finding a slow line in the lower zone indicates that the current trend is downward and vice versa, finding a slow line above the upper level shows that the current trend is upward. This is how the indicator determines the current market trend.
- Fast line of inputs (thin): determines the entry points at the intersection of the bottom line from bottom to top, these are buy signals, at the intersection of the top line from top to bottom, this is a sell signal. It is important to adjust the indicator lines in addition to the oscillator lines, as this affects the number and accuracy of signals.
In the product, different oscillators are used to display the slow and fast lines, each must be adjusted separately.
For ease of operation, the indicator shows the trend directions in the multi-time frame panel, and puts the inputs on the chart in the form of arrows. We have also added notifications for incoming imndicator signals.
MAIN SETTINGS
- High level of indicator – adjustment of the upper horizontal line of the indicator
- Middle level of indicator – adjustment of the middle horizontal line
- Low level of indicator – adjusting the level of the lower horizontal line
- Signal strategy – setting up arrows when signals appear
- Fast oscillation signal – arrows will appear on the signal of a fast oscillator, without taking into account the current trend
- Signal by current trend – arrows will be displayed according to the signal of the fast indicator, taking into account the slow oscillator (current trend)
- Fast oscillation signal – arrows will appear on the signal of a fast oscillator, without taking into account the current trend
- Signal by current trend – arrows will be displayed according to the signal of the fast indicator, taking into account the slow oscillator (current trend)
FAST OSCILLATOR
- Fast oscillator period – setting the period of the fast line, the longer the period, the slower the line will be
- Fast oscillator smooth – adjust the smoothing of the oscillator line, the greater the smoothing, the smoother the line
- Slow MA period – setting the moving average, the longer the period, the smoother the signals
- Slow oscillator period – adjusting the period of the slow oscillator, the longer the period, the slower the line
- Slow oscillator smooth – adjusting the smoothing of the oscillator line, the greater the smoothing, the smoother the line
NOTIFICATIONS SETTINGS
- Send Push Notifications – Use notifications about the appearance of new signals on the mobile version of the terminal
- Send Email – Use sending emails about the appearance of signals by email
- Send Pop Up Alerts – Send alerts about the appearance of new signals
GRAPHICS SETTINGS
- Create Arrows – show or hide arrows
- Multitimeframe dashboard – in the panel display id, minimized or full
- Font size in panel – the size of the text on the indicator panel
- Y offset – moving the panel along the Y axis
- X offset – moving the panel along the X axis
- Fast line color – the color of the fast line of the oscillator
- Slow line color – the color of the slow line of the oscillator
- Up arrow color – the color of the arrows at the signal to buy
- Down arrow color – the color of the arrows at the signal to sell
- Uptrend color Panel – the color of the downtrend in the panel
- Downtrend color Panel – the color of the uptrend in the panel
- Uptrend text color – the color of the text in the panel in an uptrend (for a minimized panel)
- Downtrend text color – the color of the text in the panel in a downtrend (for a minimized panel)
[/spoiler]