


The indicator works according to the Turtle system and classically assumes a time interval of 20 and 55 candles. The trend is tracked at a given time interval. The entry is made at the time of the breakdown of the support or resistance level. The exit signal is a breakout of the price in the opposite direction of the trend of the same time interval.
- Tools: Currency pairs, Stocks, Commodities, Indices, Cryptocurrencies
- Timeframe: Classic D1, also suitable for working with any timeframes
- Trading time: around the clock
- Money management strategies: No more than 1 risk per trade%
- When using additional orders, the risk for each additional position is 0.25%
Other developments of the author -> > https://www.mql5.com/ru/users/nechaevrealle/seller
Other developments of the author -> > https://www.mql5.com/ru/users/nechaevrealle/seller
[spoiler title=”Read More…”]
1) More short-term entry:
- The entry condition is a breakdown of the 20-day high or low.
- The trade is skipped if the previous signal was successful.
If the previous trade closed with a profit, we skip the entry. If it suddenly turns out that the breakout is profitable, then later we go to it by breaking through the 55-day channel.
If the previous trade closed with a profit, we skip the entry. If it suddenly turns out that the breakout is profitable, then later we go to it by breaking through the 55-day channel.
When the price breaks through this channel, we enter the deal.
2) Longer-term entry ( if the 20-day breakout was missed for the reasons mentioned above):
- The price breaks the 55-day high or low of the Donchian channel.
Please note! In approach 2, the filter for the previous transaction is not used, we always enter.
2) Longer-term entry ( if the 20-day breakout was missed for the reasons mentioned above):
- The price breaks the 55-day high or low of the Donchian channel.
Please note! In approach 2, the filter for the previous transaction is not used, we always enter.
Please note! In approach 2, the filter for the previous transaction is not used, we always enter.
Stop Loss
1) In the classic version, there is a simplified form of calculation for turtles. It looks like this:
In order to work with the stop loss calculation formula, you should add the ATR indicator to the chart:
StopLoss = ATR (20) * 2
StopLoss = ATR (20) * 2
2) We offer an additional option for calculating the stop loss. This is the output on the middle line of the indicator.
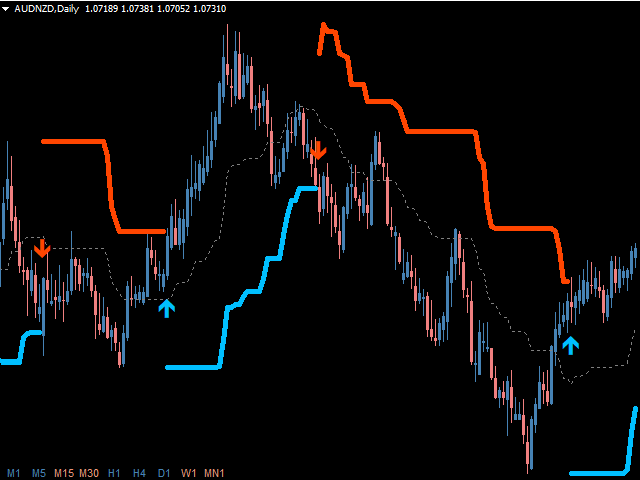
The screenshot in the product description shows both versions of StopLoss:
- The ATR indicator with a period of 20 is displayed in the lower part. Thus, in the first calculation, the stop loss will be equal to 389*2 = 780 points.
- The upper part of the screenshot shows the estimated Stop Loss level for the second strategy, that is, on the middle line. The second option is Stop Loss = 745 points.
As you can see, the stop loss levels in the first and second cases are different, but they have similar indicators. You can use any of the presented options in your trading.
They are installed at a distance of at least every 0.5 ATR from the entry point.
- Period Donchian – The channel period. Based on the previous specified number of candles, from the lower to the upper price level. At channel breakdowns, we get signals about a trend reversal.
- Maximum bars for calculation – The number of bars to calculate the indicator
NOTIFICATIONS SETTINGS
- Send Push Notifications – Use notifications about the appearance of new signals on the mobile version of the trader’s terminal
- Send PopUp Alerts – Use pop-up notifications
- Send Email – Use sending messages about the appearance of signals to the trader’s email address
GRAPHICS SETTINGS
- Multitimeframe dashboard – A kind of display panel, minimized or full
- Font size in panel – Size of the text on the indicator panel
- Y offset-moving the multiframe panel along the Y axis
- X offset–moving the multiframe panel along the X-axis
- Color Sell Line – Color of the upper line of the indicator
- Color Buy Line – Color of the lower line of the indicator
- Color Average Line – The color of the average line of the indicator
- Uptrend Color Panel – The color of the ascending direction in the panel
- Downtrend Color Panel – The color of the descending direction in the panel
- Up Color Main Panel – The color of the uptrend in the panel
- Down Color Main Panel – The color of the downtrend in the panel
We are happy to provide our developments for free, but due to our limited time, all free products are provided without any support. Thanks for understanding.
[/spoiler]