


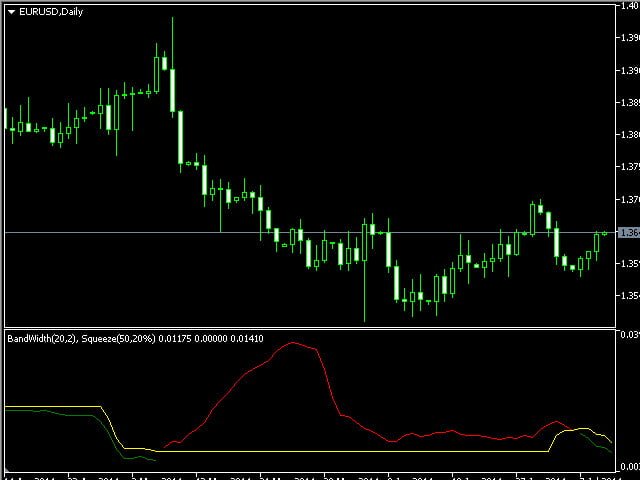

The indicator allows you to configure your own compression criteria, showing when the Bollinger Bands are compressed and begin to expand again. BandWidth is the numerical difference between the upper and lower bands of the Bollinger Bands indicator. This indicator shows the BandWidth line, as well as the compression or threshold line equal to the lowest BandWidth value plus the percentage you set. The compression line is yellow. The BandWidth line below the compression line is green, and the BandWidth line above the compression line is red. After calculating the compression line, you can use this indicator to determine the possible start of a trend price movement along one of the Bollinger bands with increasing volatility.
In the input parameters, you can tighten or loosen the compression line by changing the percentage of the minimum BandWidth value that will be added to the minimum BandWidth value. In the input parameters, you can also change the number of history bars to calculate the minimum BandWidth value. Use this indicator in conjunction with the standard Bollinger Bands indicator included with the platform to track band compression and expansion. Input parameters:
- Band_Periods – the number of bars used in the SMA to calculate BandWidth.
- Deviations – the number of standard deviations used to create the Bollinger Bands for calculating BandWidth.
- BandWidth_Bars – the number of bars on the history to calculate the minimum BandWidth value.
- BandWidth_Percent – the percentage to add to the minimum BandWidth value. If you need to set the threshold line to 20% above the minimum BandWidth value, specify 20 here.
[spoiler title=”Read More…”]
Calculating the compression BandWidth / threshold line:
[/spoiler]