


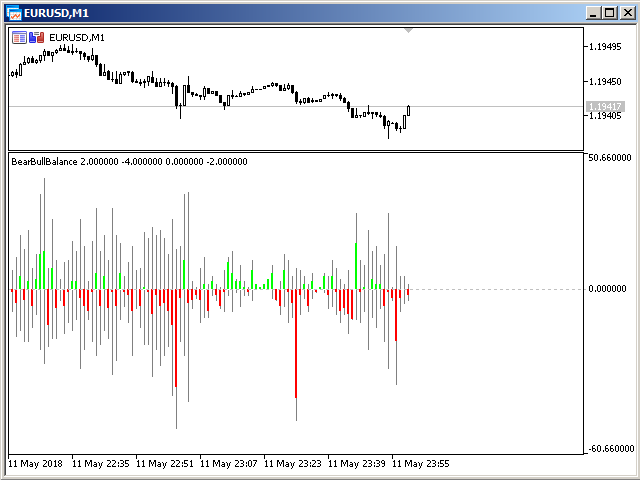

The indicator displays the number and ratio of price rise and fall ticks for each candle on the chart. The upper part of the histogram in the form of thin lines shows the number of ticks of price growth (bull strength), and the lower part shows the number of ticks of price decline (bear strength). The bolder bars of the histogram represent the difference between the strength of the bulls and the strength of the bears. The positive difference is shown in green, and the negative difference is shown in red.
The increase in the strength of the bulls occurs at the moment when the Ask price of the current tick has become greater than the Ask price of the previous tick. The increase in the strength of bears occurs when the Bid price of the current tick has become less than the Bid price of the previous tick.