


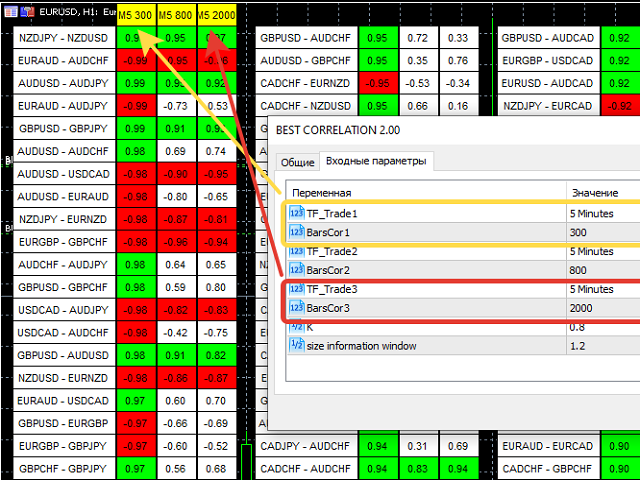

A script showing the correlation for three selected zones at once (TF-bar)
In the parameters, select 3 options
The data is displayed sorted by the first zone
The script also creates a file in which it writes all the data without sorting.
In this way, you can expand the number of zones to any number and perform the analysis in exsel
The script also creates a file in which it writes all the data without sorting.
In this way, you can expand the number of zones to any number and perform the analysis in exsel
In the script parameters, 3 zones are set
- TF_Trade1 =PERIOD_M5;
- BarsCor1 = 300;
- TF_Trade2 =PERIOD_M5;
- BarsCor2 = 800;
- TF_Trade3 =PERIOD_M5;
- BarsCor3 = 2000;
- K = 0.8; / / the coefficient above which the skrit highlights the coefficients of interest in color
- WindSize = 1.2; / / information window size