


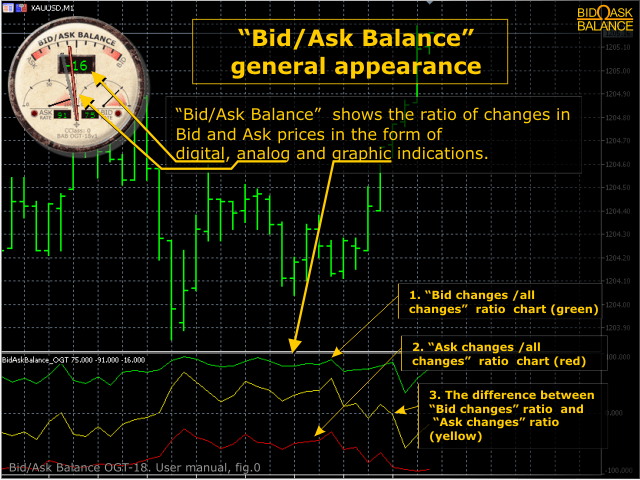

The indicator measures and displays the difference in the number of price changes “Bid” and ” Ask ” in the form of digital, analog and graphical indicators.
It is intended for market research and for determining the exit points during scalping trading on chart periods of no more than one hour (use on older periods is not prohibited, but it is not informative due to the large number of accumulated values).
The “Bid” and “Ask” prices do not change simultaneously for most symbols. Often you can see how one of the prices is fixed at a certain value, while the second changes with a high frequency, which causes a change in the spread of the symbol (which, in turn, is associated with a change in the mood of active players in the market). In general, the price behavior is not deterministic depending on the ratio of the number of price changes Bid and Ask (the indicator is not predictive), but often you can identify key patterns. For example, a sharp mixing of the ratio of price changes in the Ask direction(a negative value of the indicator(2), a shift of the pointer arrow (1) to the left (see Figure 1.)) with an increasing trend on the “Gold” symbol indicates a close termination of the trend (as well as a shift in the Bid direction for a downtrend). In turn, keeping the ratio of changes approximately equal over several measurement periods indicates that the trend continues regardless of the prevailing value.
[spoiler title=”Read More…”]
- The ratio of the number of ” Ask ” price changes to the total number of price changes: readings 4 and 5 (Fig. 1) and Graph 3 (Fig. 0)
- The ratio of the number of Bid price changes to the total number of price changes: readings 6 and 7 (Fig. 1) and Graph 1 (Fig. 0)
- The difference between the ratio of changes in ” Bid ” and “Ask”: readings 1 and 2 (Fig. 1) and Graph 2 (Fig. 0)
- The value of the difference in the previous measurement segment: readings 3 (Fig. 1) and visually on the graphs
Drag the indicator to the desired chart. At the start, the indicator is displayed in the upper-left corner, but you can move it to the desired location by clicking on it with the left mouse button, then moving it to the selected location.
The indicator does not use any input parameters. The chart display colors can be configured on the “Colors” tab of the indicator settings window.
Attention!
The indicator readings in the testing mode do not make sense due to the synthetic nature of the generated ticks. This free version of the “Bid/Ask Balance” () indicator has the following usage restrictions:
- Graphical readings are displayed only for the last 9 measurement periods (bars of the main chart).)
- The indicator dial cannot be moved from the starting position
[/spoiler]