


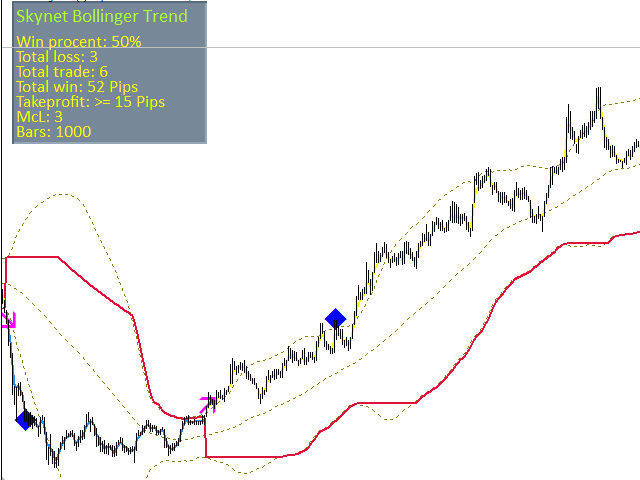

This indicator displays the entry points to the market using Bollinger bands and exit points, which are determined by a given distance in points from the entry point. The indicator line above the price indicates a bearish trend. If the line is below the price, then there is a bullish trend in the market. The information panel shows the results of the indicator so that you can configure it more accurately and see how the parameters affect the result. Notification of entry and exit points comes to the phone.
Advantages
- Skipping many false breakouts. The ability to choose the settings for the trending market and the flat.
- The signals are not redrawn.
- Visual display of bullish and bearish trend based on Bollinger bands.
- Clearly shows the profit in points, the number of successful and unsuccessful transactions, the percentage ratio, and the number of losses in a row.
Parameters
- period – The averaging period for calculating the indicator. The default value is 20;
- deviation – The number of standard deviations from the main line. The default value is 2;
- smooth – the period of the smoothing line. The default value is 2;
- space – the averaging period to bypass false breakouts. The default value is 5;
- flat – coefficient to enhance the curvature of the trend line. The default value is 1;
- q is the gain of the space mode. The default value is 0.1;
- cutoff – value for calculating profit in points (takeprofit). The default value is 5;
- bars – the number of bars to calculate. The minimum value is 1000;
- notification – sending messages to the phone (Metaquotes ID). The default value is 1; 1 – yes, 0 – no;
- panel – permission to display the information panel on the screen. The default value is 1; 1 – yes, 0 – no;
- allbars – use of all bars for calculation. The default value is 1; 1 – yes, 0 – no;
Information panel
The information panel shows the following information:
- win percent – the ratio of profitable and unprofitable transactions as a percentage.
- total loss – the total number of losing trades.
- total trades – the total number of trades.
- total win – the amount of profit in points for the number of candles.
- takeprofit – the distance from the entry point to the high or low candle on which the profit is measured.
- mcl – the maximum number of losses in a row.
- bars – the number of bars to calculate.
Additional information
The space and q parameters need to be fine-tuned to skip as many false breakouts as possible. It is necessary to coordinate the parameters so as to get the maximum profit in total win and the minimum value in mcl. The space parameter should be selected experimentally to find the best inputs and identify long-term trends. The mcl indicator is important for using the indicator for trading on the martingale principle, where the minimum sequence of losses plays a big role.
The indicator works only with closed bars.
[spoiler title=”Read More…”]
This indicator displays the entry points to the market using Bollinger bands and exit points, which are determined by a given distance in points from the entry point. The indicator line above the price indicates a bearish trend. If the line is below the price, then there is a bullish trend in the market. The information panel shows the results of the indicator so that you can configure it more accurately and see how the parameters affect the result. Notification of entry and exit points comes to the phone.
- Skipping many false breakouts. The ability to choose the settings for the trending market and the flat.
- The signals are not redrawn.
- Visual display of bullish and bearish trend based on Bollinger bands.
- Clearly shows the profit in points, the number of successful and unsuccessful transactions, the percentage ratio, and the number of losses in a row.
- period – The averaging period for calculating the indicator. The default value is 20;
- deviation – The number of standard deviations from the main line. The default value is 2;
- smooth – the period of the smoothing line. The default value is 2;
- space – the averaging period to bypass false breakouts. The default value is 5;
- flat – coefficient to enhance the curvature of the trend line. The default value is 1;
- q is the gain of the space mode. The default value is 0.1;
- cutoff – value for calculating profit in points (takeprofit). The default value is 5;
- bars – the number of bars to calculate. The minimum value is 1000;
- notification – sending messages to the phone (Metaquotes ID). The default value is 1; 1 – yes, 0 – no;
- panel – permission to display the information panel on the screen. The default value is 1; 1 – yes, 0 – no;
- allbars – use of all bars for calculation. The default value is 1; 1 – yes, 0 – no;
The information panel shows the following information:
- win percent – the ratio of profitable and unprofitable transactions as a percentage.
- total loss – the total number of losing trades.
- total trades – the total number of trades.
- total win – the amount of profit in points for the number of candles.
- takeprofit – the distance from the entry point to the high or low candle on which the profit is measured.
- mcl – the maximum number of losses in a row.
- bars – the number of bars to calculate.
The space and q parameters need to be fine-tuned to skip as many false breakouts as possible. It is necessary to coordinate the parameters so as to get the maximum profit in total win and the minimum value in mcl. The space parameter should be selected experimentally to find the best inputs and identify long-term trends. The mcl indicator is important for using the indicator for trading on the martingale principle, where the minimum sequence of losses plays a big role.
The indicator works only with closed bars.
[/spoiler]