


The market is unfair, if only because only 10% of the players manage 90% of the capital. The average trader has little chance to resist these “predators”. But there is a way out, you just need to go to the other side, you need to be among these 10% of “sharks”, learn to recognize their intentions and move with them.
Volume is the only leading factor that works flawlessly on any period and any trading instrument. First, the volume is generated and accumulated, and only then there is a price movement. The price moves from volume to volume. The areas of volume accumulation on the chart are very strong resistance/support levels and are regularly “tested” by the price, providing an optimal opportunity to enter the market. And the method of trading using this indicator is to ensure that trade is strong from one region to another.
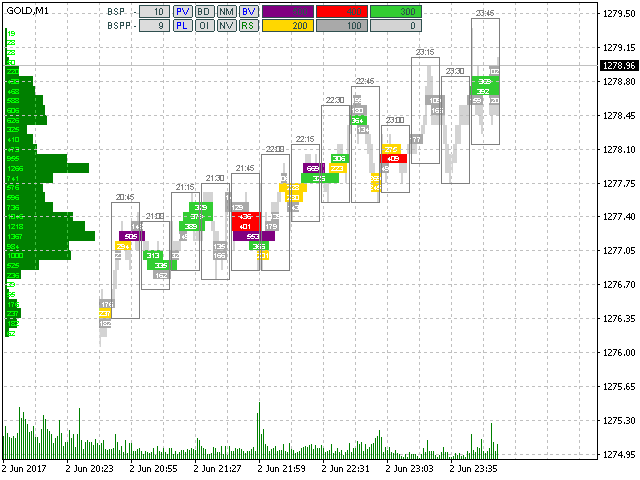
The BoxChart indicator calculates volume clusters, sorts them according to their fullness, and marks them with the appropriate color. In addition, the indicator summarizes all clusters and displays the result on the price axis, as a scale of horizontal volume, that is, in the form of a market profile.
The indicator works on all periods available in the terminal, but for calculations it uses historical data of smaller (relative to the current) periods M1, M5, H1, H4 and D1. Before installing the indicator, load the history of these periods by scrolling the chart with the mouse. If there is no data available, the indicator will display a corresponding message and perform plotting only in the area of the chart where this data is available.
[spoiler title=”Read More…”]
The indicator makes all constructions only in the visible area of the chart view, but it is possible to scroll to the history. When the graph is scrolling, the clusters may flicker, which is normal, since they are being re-sorted.
Clusters that have the same color but different lengths (within a single price line) are approximately equal in volume content.
- BSP – increment/decrease of the fixed step of the price grid. Set in the ” old ” points. If the value is zero, the calculation step is taken from the parameter set by the BSPP button.
- BSPP – increment/decrease of the dynamic step of the price grid. Set in monitor pixels.
- PV-enables / disables the display of the volume profile.
- PL-volume profile on the left/right.
- BD – in this mode, each cluster contains not the volume, but its concentration. The volume of the cluster may not be very large and even imperceptible, but if its concentration per unit of time is high, this indicates high trading activity on a given candle / candles, at a given price level.
- OI-enables / disables the mode of open interest obtained mathematically by sequentially zeroing the mutually absorbing volumes. Only the volumes that were unaffected after this operation are displayed in the clusters and in the profile.
- NM-enables / disables the mode of line-by-line gluing of neighboring clusters.
- VT-Volume scale:
- VT-tick volumes
- VR – Real volumes
- VN – without volumes (volumes are emulated according to the TPO principle).
- BV-enables / disables the display of period frames.
- RS-reset to default settings.
- VT-tick volumes
- VR – Real volumes
- VN – without volumes (volumes are emulated according to the TPO principle).
- DigitsFontSize – the font size of the labels on the clusters.
- BordersFontSize – the font size of the labels above the period borders.
- Automatic sorting of clusters is performed in 1/6 increments. As a result, we have six color gradations. The color matching of these gradations for clusters can be configured with color variables: LowestBoxColor – up to 1/6, LowBoxColor – up to 2/6, MiddleBoxColor – up to 3/6, MediumBoxColor-up to 4/6, HighBoxColor-up to 5/6, HighestBoxColor-up to 6/6 of the maximum cluster in the visible viewport.
- Manual sorting of clusters is set by the user using input variables: HighestBoxValue, HighBoxValue, MediumBoxValue, MiddleBoxValue, LowBoxValue,LowestBoxValue, which specify the upper limit of the cluster volume, when exceeding which the cluster gets the appropriate color.
The other input variables refer to other color settings, and their purpose is clear from their name.
[/spoiler]