


NO REPAINTS
By using the Multi Period and Multi Timeframe
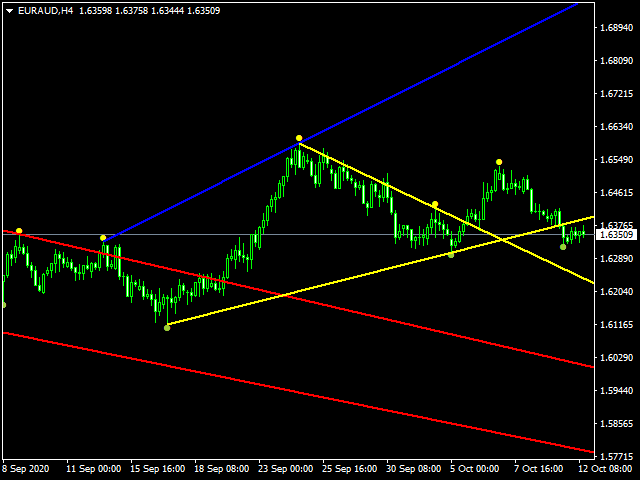
– Easily identify the potential reversal and breakout levels.
– Plot the patterns like triangles, head and shoulders, wedge patterns, cup and handle patterns etc.
– Indicator draws arrows only when a breakout happens.
– You can see the uncompleted/forming trendlines as well.
INPUTS:
Signal Mode: After Close ( Puts Arrow after the candle closing above/below the trendline )
Instant ( Puts Arrow as soon as the price breaks above/below the trendline )
Time Frame 1 : Choose the TF
Fractal Period : Enter the period for the chosen TF
Time Frame 2 : Choose the TF
Fractal Period : Enter the period for the chosen TF
Time Frame 3 : Choose the TF
Fractal Period : Enter the period for the chosen TF
*** If you would like to see only one TF and one period, set the others same as the first one.
Colors :
* Chose the colors of the Completed Trendlines.
* Colors 1 … For the first TF and Period
* Colors 2 … For the second TF and Period
* Colors 3… For the third TF and Period.
NOTES
- Colors of the uncompleted lines are set NONE as a default. Chose a color if you would like to see the uncompleted/forming lines.
- If there are same trendlines in different TF and/or Periods, the color of the bigger TF/Period are shown on the chart.
- To test the bigger timeframes on strategy tester, the more history must be loaded.
[spoiler title=”Read More…”]
[/spoiler]