


The Sagacious Buy N Sell indicator works on any timeframe. It displays the opening, closing, and stop prices based on bar movement, advanced mathematical calculations of the real market trend, and calculations of support and resistance levels. It confirms the direction of trade, and also determines an unfavorable time to open trades due to a possible reversal of the direction of movement.
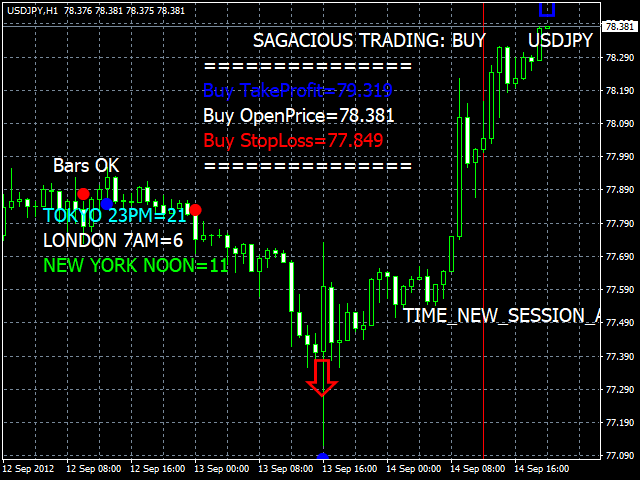
- The blue circle indicates a bullish trend (you can send a buy order near the nearest blue circle, as a reversal can occur at any time)
- SAGACIOUS TRADING: BUY-displayed on the chart
- Blue arrow-shows the direction of the trade on the chart for visual analysis
- The word BUY near the current bar shows the direction of trading
- The red circle indicates a bearish trend (you can send a sell order near the nearest red circle, as a reversal can occur at any time)
- SAGACIOUS TRADING: SELL-displayed on the chart
- Red arrow-shows the direction of the trade on the chart for visual analysis
- The word SELL (buy) near the current bar shows the direction of trading
The indicator does not display any symbols at the time of loading. The download may take several minutes or hours.
[spoiler title=”Read More…”]
- Place the order near any of the nearest colored circles on the chart.
- Set a trailing position at the point where the trend is about to reversein order to capitalize on the movement, as a reversal can occur at any time.
- The red vertical line indicates the start time of each session.
- The vertical line is not shown when selecting one of the following timeframes:
- H4
- D1
- W1
- MN
- H4
- D1
- W1
- MN
The indicator has different types of alerts, which are enabled by setting the value to true. To disable it, select false.
- Down Trend – the number of bars used to calculate the bearish trend of the indicator. Suitable values – from 70 to 84 (suitable value = 100 minus ( -) bullish trend)
- Up Trend – the number of bars used to calculate the bullish trend of the indicator. Suitable values – from 16 to 30 (suitable value = 100 minus ( -) bearish trend)
- All Bars – the total number of bars to calculate the indicator. Suitable values are from 250 to 500.
- clr1-select a color.
- clr2-select a color.
- alerts – alerts
- Enable – true
- Disable – false
- email-email alerts
- Enable – true
- Disable – false
- push – push notifications
- Enable – true
- Disable – false
- Enable – true
- Disable – false
- Enable – true
- Disable – false
- Enable – true
- Disable – false
[/spoiler]