


Candlestick Patterns Custom is a lightweight version of the Candlestick Patterns Analytics indicator, designed for use as a regular arrow indicator, and in Expert Advisors.
- Finds and marks 29 candlestick patterns on the chart (43 variants of signal patterns);
- Allows the user to adjust the signal of each model according to the results of the analysis of the Candlestick Patterns Analytics indicator;
- The indicator can be used as an arrow indicator in Expert Advisors.
Each candle model has a drop-down menu with a selection:
- No_Use – Do not use the model;
- Buy_Signal is to Use the model as a signal to buy;
- Sell_Signal – Use the model as a sell signal.
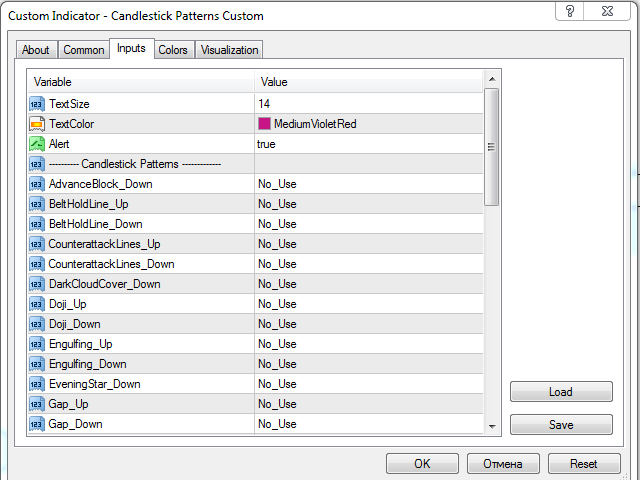
Indicator Settings:
- TextSize – the size of the text on the chart;
- textColor – the color of the text on the chart;
- Alert – enable / disable alerts;
- ———- Candle Patterns ————- – settings separator;
- AdvanceBlock_Down-the “Repulsed Offensive” model”;
- BeltHoldLine_Up-the “Belt Grab” model”;
- BeltHoldLine_Down-the “Belt Grab” model”;
- CounterattackLines_Up-the “Counterattack” model”;
- CounterattackLines_Down-the “Counterattack” model”;
- DarkCloudCover_Down-the “Curtain of Dark Clouds” model”;
- Doji_Up-the “Doji” model”;
- Doji_Down-the “Doji” model”;
- Engulfing_Up-the “Takeover” model”;
- Engulfing_Down-the “Takeover” model”;
- EveningStar_Down-the “Evening Star” model”;
- Gap_Up – model “Window”;
- Gap_Down – model “Window”;
- GravestoneDoji_Down-the “Doji-tombstone” model”;
- Hammer_Up-the “Hammer” model”;
- HangingMan_Dowm-model “”;
- Harami_Up-the “Harami” model”;
- Harami_Down-the “Harami” model”;
- InvertedHammer_Up – model “Inverted hammer”;
- LongLeggedDoji_Up-the “Long-legged Doji” model”;
- LongLeggedDoji_Down-the “Long-legged Doji” model”;
- MatHoldPattern_Up-the “Hold on Tatami” model”;
- MorningStar_Up-the “Morning Star” model”;
- OnNeckLine_Up – model ” At the neck line”;
- OnNeckLine_Down-model ” At the neck line”;
- Piercing_Up-the “Gap in the Clouds” model”;
- SeparatingLines_Up-the “Separation” model”;
- SeparatingLines_Down-the “Separation” model”;
- ShootingStar_Down-Shooting Star model”;
- SideBySideWhite_Up – “Adjacent White Candlesticks” model”;
- SideBySideWhite_Down-the “Adjacent White Candlesticks” model”;
- StalledPattern_Down-the “Braking” model”;
- TasukiGap_Up-the “Tasuka Gap” model”;
- TasukiGap_Down-the “Tasuka Gap” model”;
- ThreeCrows_Down-the “Three Crows” model”;
- ThreeLineStrike_Up-the “Triple Strike” model”;
- ThreeLineStrike_Down-the “Triple Strike” model”;
- ThreeMethods_Up-the “Three Methods” model”;
- ThreeMethods_Down-the “Three Methods” model”;
- ThreeWhiteSoldiers_Up-the “Three White Soldiers” model”;
- Tweezer_Up – model “Tweezers”;
- Tweezer_Down – model “Tweezers”;
- UpsideGapTwoCrows_Down-the “Two Flying crows” model.
[spoiler title=”Read More…”]
The indicator allows you to use the signals of the Candlestick Patterns Analytics indicator without volume calculations and, accordingly, without loading the terminal.
The indicator is configured according to the results from the Candlestick Patterns Analytics indicator report.
For example, a certain candlestick pattern for the selected pair and timeframe gives a positive result when trading for a buy, therefore, in the settings in the drop-down menu of this model, select “Buy_Signal”. In this way, you can configure any number of models.
I will help you with setting up indicators, applying them, and analyzing them.
[/spoiler]