


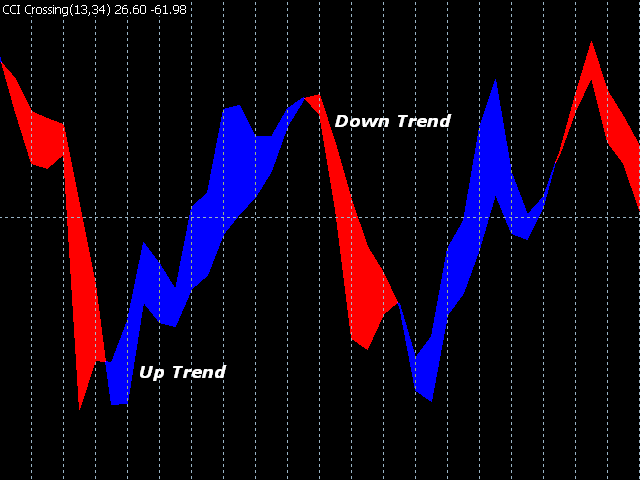

The CCI Crossing indicator displays in a separate window the intersection of two CCI (Commodity Channel Index) – fast and slow.
The intersection area is colored blue when the fast CCI is higher than the slow CCI.
The intersection area is colored red when the fast CCI is lower than the slow CCI.
The indicator is a convenient tool for measuring the deviation of the current price from the average price and determining the levels of overbought or oversold market.
The indicator can work on any timeframe and will be useful in strategies where the method of crossing two CCIs is used.
The “Inputs” tab of the indicator allows you to select for each CCI:
- Period (Fast Period, Slow Period);
- one of the seven types of applied price (Close, Open, High, Low, Median, Typical, Weighted).
The “Colors” tab of the indicator allows you to select the color of the areas where the indicator intersects.
- fast period – the number of bars used to calculate the fast CCI;
- fast applied price-choose from seven types of applied price for fast CCI;
- slow period – the number of bars used to calculate the slow CCI;
- slow applied price-choose from seven types of applied price for a slow CCI.