


The indicator finds and draws price stations or lines, reading information from several timeframes at once (from the current, from the second and third). You can adjust the colour and line thickness to every timeframe. You can also place a different space between the highs and lows to build stations or lines.
- background – maximum number of bars for construction channels or lines;
- Distance – the minimal distance from one maximum (or minimum) to another when plotting;
- alter – change a few bars back from the current price, where a channel breakout is possible;
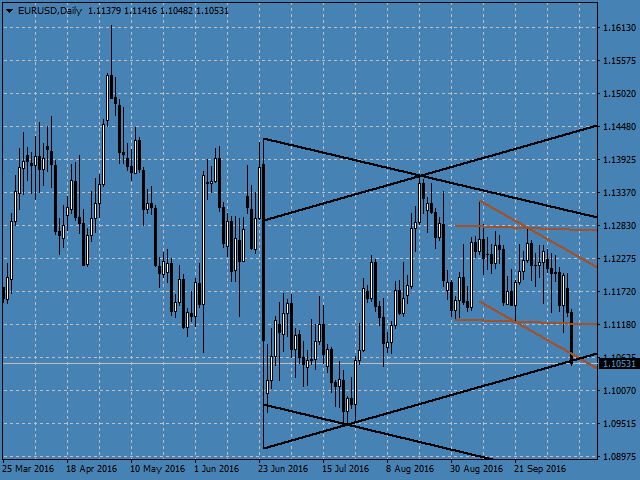
- DrawChannels-draw channels or trend lines (if this option is enabled, channels are drawn);
- ChannelsColorCurrentTimeframe – color of the lines (or channels) of the current timeframe;
- ChannelsWidthCurrentTimeframe – the thickness of the lines (or channels) of the current timeframe;
- SecondTimeframe-select the second timeframe;
- ChannelsColorSecondTimeframe – color of the lines (or channels) of the second timeframe;
- channelwidthSecondTimeframe – the thickness of the lines (or channels) of the second timeframe;
- ThirdTimeframe-select the third timeframe;
- ChannelsColorThirdTimeframe – color of the lines (or channels) of the third timeframe;
- ChannelsWidthThirdTimeframe – the thickness of the lines (or channels) of the third timeframe;