


The “Chart Synchronization” utility (SynchronizeCharts indicator) will help a trader when conducting simultaneous trading on several
financial instruments, since it automatically scrolls all or selected terminal charts in accordance with the position of the leading
chart.
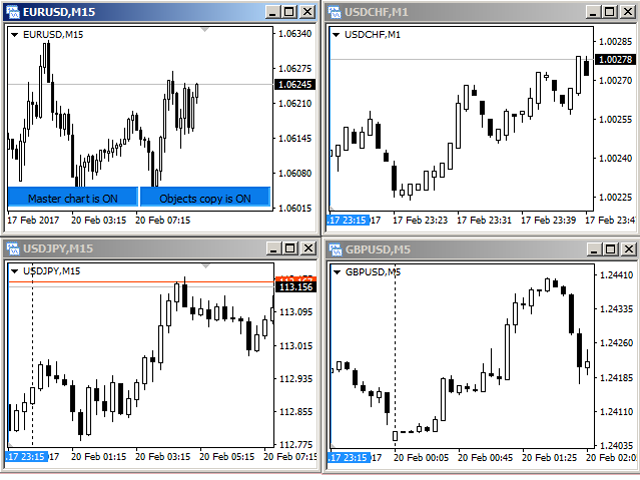
Screenshot 1 shows four graphs. The EURUSD chart is the leading one, because the SynchronizeCharts indicator is connected to it.
The remaining three charts begin their display on the time scale from the time of 2017.02.17 23: 15. All further movements of the EURUSD chart
in time, they will lead to the corresponding movement of the dependent graphs.
By default, the line of the matching bar is displayed on the dependent charts – a vertical line of blue color. It indicates the exact time from
which the data display begins on the master graph. This indication is required for those cases when the slave graph cannot be
scrolled to the specified date and time. For example, if the timeframe of the master chart is set to M1, and the timeframe of the slave chart is MN, and the time of the master
chart falls on the current bar of the slave chart (see screenshot 2).
If the line interferes, you can disable its display by selecting “No” in the “Display line?”parameter (see
the parameters section “The line of the match bar”).
[spoiler title=”Read More…”]
By default, the indicator selects all charts open in the terminal as slave charts. But you can also configure the indicator in such a
way that only those whose symbol coincides with the symbol of the leading chart or those whose timeframe are driven from the existing charts
which coincides with the leading graph. This is done using the “Synchronize graphs” parameter, which contains three synchronization
options: “All” (by default), “By symbol” and “By timeframe”. If you select the value “By timeframe”, then
only USDCHF, M1 will be the driven chart (see screenshot 3).
Accordingly, if you select the value “By symbol”, then only EURUSD, M5 will be the driven chart (see screenshot 4).
The utility allows you to synchronize graphic objects. If a graphical object supported by the indicator is displayed on the master chart
, it will immediately appear on each of the slave charts (see screenshot 5). Deleting or changing the properties of an object leads to
similar changes on the slave graph.
Supported objects: vertical line, horizontal line, trend line, trend line by angle, circular lines equidistant
channel standard deviation, linear regression channel, Andrew’s pitchfork, line, Gann, Gann fan, Gann grid, Fibonacci lines,
Fibonacci time zones, Fibonacci fan, Fibonacci arcs, Fibonacci channel, Fibonacci expansion, rectangle, triangle,
ellipse, icons, arrows, text.
For each of the object types, there is a parameter that allows or prohibits copying of this type of objects.
Buttons of the leading chart
In the screenshots 1-5, the leading chart is easily found by the buttons located in the lower right corner of the chart. If necessary
, you can disable the display of these buttons by selecting “No” in the “Display control buttons?” parameter.
If the buttons are displayed, then pressing the “Master chart is ON” button will transfer its state to “Master chart is off”. From this point on, moving the
master graph along the time scale will not automatically move the slave graphs.
Pressing the “Objects copy is ON” button puts it in the “Objects copy is off” state, deletes copies of graphic objects on the slave graphs and
stops tracking the updating of graphic objects on the master graph.
Crosshair
If the “Using crosshair” parameter is set to “YES”, then the crosshair functionality becomes available.
The crosshair is displayed and hidden by pressing the ” Tab ” key. If the synchronization of graphic objects is enabled, the
crosshair will be displayed on all the slave graphs. Fixing the crosshair at any point – click with the left mouse button. A line will appear with a
hint containing the following data relative to the fixing point: the number of bars, the number of points, the current price. The next
left mouse click moves the crosshair to the current point.
[/spoiler]