


The Footprint indicator makes it possible to see the accumulation of volume inside the candle, based on exchange data. The accumulation and distribution of volume allows you to assess the current trend in the market, as well as predict the behavior of market participants.
- The 26 most common exchange-traded instruments (currency, oil, gold, indices, etc.)
- time charts from m1 to w1
- arbitrary Range graphs
- built-in profiles
- convenient visual panel
- scaling of the chart that allows you to see accumulations during high volatility
- adjusting the appearance to the current tasks
Remark: The #Footprint indicator is designed for maximum convenience of its use, but at the same time we are still dealing with an indicator, and not with a separate application. Also note that in the network, the term Footprint is most often used along with the term Order Flow
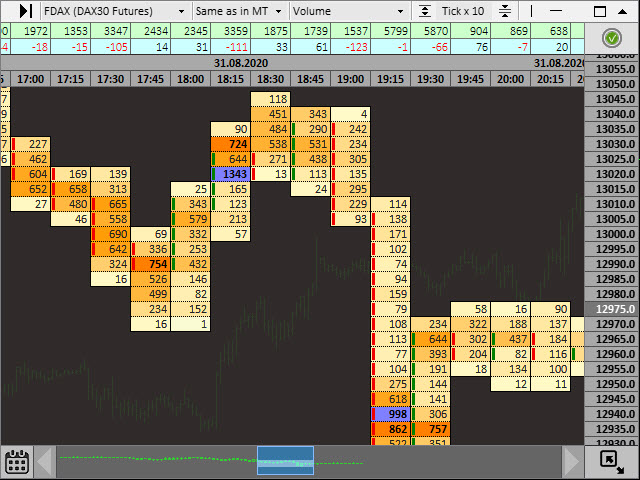
Please note that the green and red squares on the left side of the candle indicate the body of the candle and the Open/Close parameters (opening/closing prices). Green – bullish candle, Open at the bottom, Close at the top. Red – bearish candle, Open – at the top, Close – at the bottom.
The graph is automatically loaded when it approaches its boundaries of the loaded area. You can also use a calendar. Futures data have been glued since January 1, 2020 (for some instruments since February 1). A large amount of downloaded data will slow down the operation of the terminal.
[spoiler title=”Read More…”]
The automatic data update mode can be disabled by CTRL BREAK combination, this mode will be enabled when the timeframe is changed or the indicator is removed/added.
[/spoiler]