


Control Trading Squeeze displays volatility, which helps to determine/confirm the trend
It is recommended to use this indicator to find/confirm breakouts of support/resistance levels or any patterns, trend, retracements, etc.
It works on any symbol and timeframe.
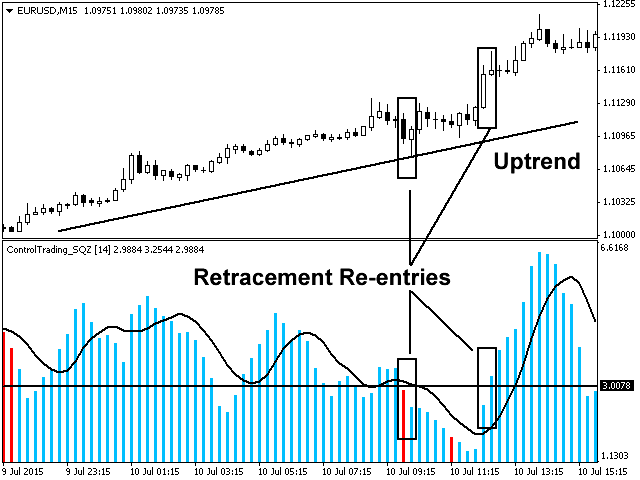
The indicator displays normalized volatility (regardless of the symbol price). It uses different colors for bullish and bearish trends and draws a fast moving average line to smooth out the levels.
For example, the value of the indicator level 3.0 means that the volatility of the symbol is equal to the average true range (ATR) multiplied by three.
Levels that easily exceed the value of 3.0-3.5 can warn of strong price movements.
Changing the color of the histogram indicates a change in the trend.
An upward-pointing histogram indicates the acceleration/strength of the current trend.
A downward-pointing histogram indicates a slowdown/weakness of the current trend, but does not mean its mandatory change.
- Period: the number of candlesticks for calculating volatility and ATR.