


The demo version differs from the full version in that it displays data up to and including 2019.
The full version is here
The program (script) displays information about corporate reports and stock dividends on the monitor; the information is downloaded from the website
- Report date
- Earnings per share (EPS)
- Income (Revenue)
- Market capitalization
- Amount of dividends
- Date of payment of dividends
- Dividend income
The program works according to the following principle:
- Searches for information on the ticker on which the program is running.
If the data is not found, it suggests using the search.
Search by ticker – the ticker should be written in quotation marks, for example: “BA” or “ba”.
Search by company name – the company name should be written without quotation marks, for example: Apple or ford.
All the options found are displayed in the “Experts” tab.
To display the data on the chart, you need to enter the found number from the experts tab (which is in square brackets) with the sign no. for example: #241 or #241.
The entered numbers are remembered.
If you want to change the previously selected number, then when the program asks “is this the right company?”, you need to click no, and then find and enter the new number.
To clear all pinned numbers, delete the “Custom Ticker List” file at the path “MQL5FilesCorporate Report”.During the search for information, the background of the graph changes color to blue. - Creates vertical lines on the chart that correspond to the dates of the dividend reports.
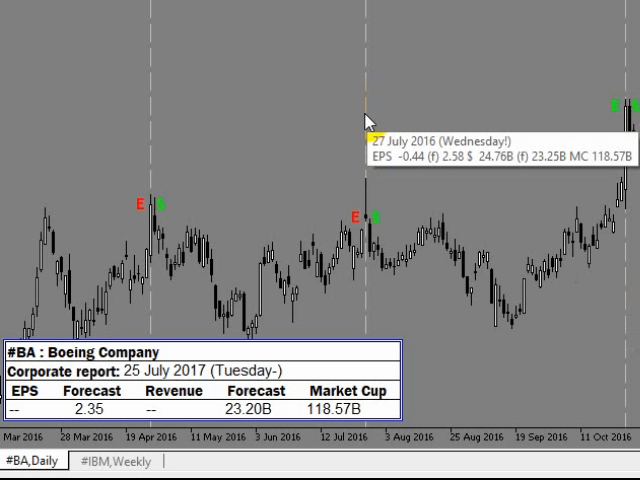
- Creates vertical lines on the chart that correspond to the dates of published corporate reports. The tooltip for each of the lines contains information about this corporate report.
- Near the vertical lines, the graph is marked “E“,”$“:
- if earnings per share (EPS) exceeds the forecast, then the “E” mark is green,
- if it does not meet expectations, then red;
- if the Revenue indicator exceeds the forecast, thenthe green ” $ ” mark is placed,
- if it does not meet expectations, then red.
- At the bottom left in the table are listed: the ticker (the one on which the program was launched) and the company name (corresponds to the one that is downloaded from the site),
date and information about the report that is expected or published no more than 5 days ago.
(after 5 days after the report is published, it moves to the chart as a vertical line and starts searching for the date of the next report.) - The” “”–“”!” marks in the report date indicate the time when the report was published according to the following principle:
- Publishing a report:
- – Before the market opens,
- After the market closes,
- ! Before the market opens or after the market closes, there is no information about this.
- To understand the trend of the company’s indicators, the monitor displays graphs of indicators: earnings per share( EPS), income (Revenue$). The graphs of these indicators are based on the downloaded reports and the data that is available in the downloaded reports. If the site does not have any of the reports, the schedule will be built on the basis of the reports that are available. If the downloaded report does not contain the required indicator, then this value will be zero in the graph. These graphs can be moved or deleted. The report that is located in the table at the bottom left does not get into the charts, only those that are displayed as horizontal lines on the chart get into the charts.
- The program works in Russian and English.
[spoiler title=”Read More…”]
- Near the vertical lines, the graph is marked “E“,”$“:
- if earnings per share (EPS) exceeds the forecast, then the “E” mark is green,
- if it does not meet expectations, then red;
- if the Revenue indicator exceeds the forecast, thenthe green ” $ ” mark is placed,
- if it does not meet expectations, then red.
- Publishing a report:
- – Before the market opens,
- After the market closes,
- ! Before the market opens or after the market closes, there is no information about this.
The list of instruments (stocks, stock, CFDs, ADR) that this program workswith: there are 18,054 tickers; The list includes tickers from 80 countries.
Before use:
- You need to add 2 URLs to the list of allowed URLs. “Settings” – > “Expert Advisors” – > > “Allow WebRequest for the following URLs”>>.
Note::
- For more comfortable use, we recommend a vertical monitor resolution of 900 or more.
- The program and all the information used in it depend on the site investing.com and they work as long as it is possible to get information programmatically from the specified links.
The program and all the information used in it depend on the site investing.com and they work as long as it is possible to get information programmatically from the specified links.
[/spoiler]