


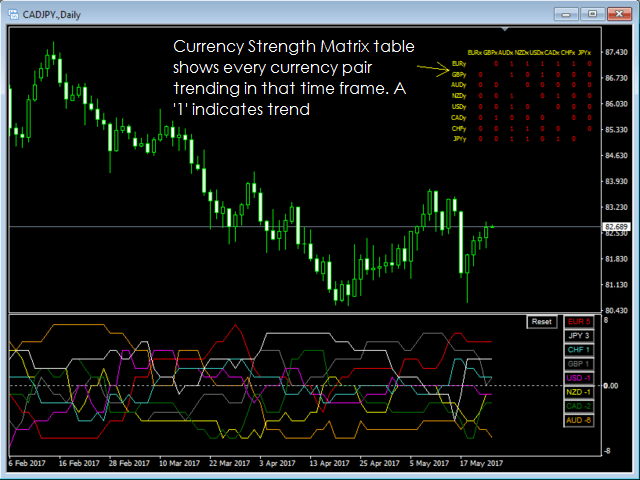

A strength indicator that measures price movement to confirm trend and strength. An advanced multi-currency and multi-time frame indicator that allows you to see all currency pairs in a trend, as well as the strongest and weakest currencies driving these trends, at a glance on the chart.
This indicator intelligently analyzes the price movements of 28 currency pairs simultaneously on all timeframes in real time, so you will always know about the strongest and weakest currencies in the pair. The Currency Strength Matrix sets the true strength of a currency by measuring price action and cyclicity to determine the trend – the only correct method for determining the trend.
The most important factor when trading currencies is the relative strength of the currencies. One of the main advantages of currency trading compared to other markets is the ability to choose two currencies to pair in order to get the maximum probability of a successful result. Without understanding the underlying strength of the currencies, the success of trading on the selected currency pair is unlikely.
Currency Strength Matrix works with 8 major currencies (USD, EUR, JPY, GBP, AUD, CAD, NZD, and CHF), which combine to produce 28 currency pairs. You can trade these pairs using this indicator (the full list of pairs is shown in the screenshots).
[spoiler title=”Read More…”]
Each currency pair is ranked from 7 to -7 on each timeframe. 7 means that the currency is in an uptrend against the other 7 major currencies, and -7 means that it is in a downtrend against the 7 other major currencies. These estimates change when a new trend appears or when an existing one breaks.
Currency Strength Matrix can be used in combination with any existing trend strategy. Currency strength precedes strategy. This means that it will help you choose a pair to trade before applying your existing strategy.
Recommendations
- Draw Labels: Disable all currency estimates and the Matrix table, leaving only the indicator lines.
- Draw Matrix: Enable or disable the Matrix table separately. If true, the table will be shown in the upper-right corner of the graph.
- Label font size: the size of the text in the Matrix table and currency estimates.
- Currency Label Color (for grid): the color of the currency names on the X and Y axes of the Matrix grid.
- Data Label Color (for grid): the color of the currency ratings in the Matrix grid.
- How many bars to calculate: the number of bars to calculate. This determines how far the indicator lines extend in the history. Increase this value to expand the history range for testing. A minimum of 50 bars is recommended.
- ATR multiplier for over-sized detection: an ATR multiplier that allows you to avoid abnormally large bars (bars with sizes larger than the specified ATR value will not be taken into account when analyzing cycles), so that they do not distract from the main cycles. The default ATR value is 3, you can adjust as you like to account for larger or smaller bars. We recommend using the default value.
- Initial calculation frequency: the rate at which the first 300 bars are read at the first load. It can take a value between 1 and 10 seconds.
- Final calculation frequency: the frequency with which the indicator checks for changes in the price movement cycles and, consequently, estimates after all the bars are fully loaded.
[/spoiler]