


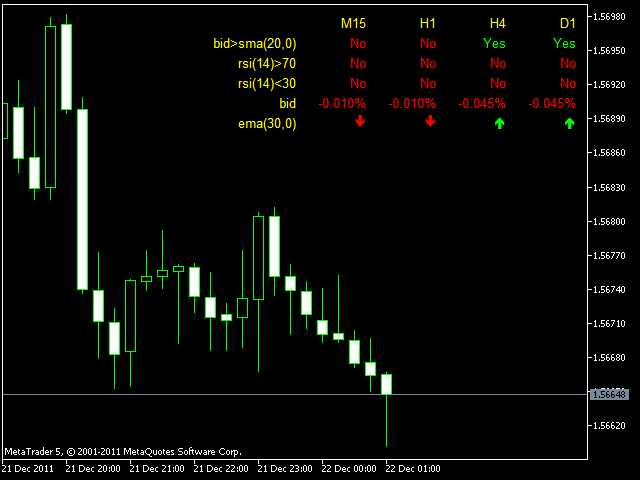

The Custom Panel indicator allows you to collect all the necessary information in one table.
You can configure the table contents yourself. Each of the rows displays the status of the specified conditions or values. The columns of the table correspond to timeframes. The panel can contain up to 10 rows and up to 8 columns.
Usage examples:
Row: Price > EMA (30)
Mode: YES_NO
Value: Condition check: Price > EMA(30)
Line: Ask < Bands[L]
Mode: YES_NO
Value: Condition check: Price Ask < lower border of the Bollinger band
String: CCI(16)
Mode: PERCENT
Value: displays the value of the percentage change in CCI(16) relative to the previous bar
String: MACD[S](12,20,10)
Mode: ARROWS
Value: indication of the ascending/descending arrow of the signal line of the MACD indicator (12,20,10)
String: Stoch[M] > Stoch[S]
Mode: YES_NO
Value: condition check: the main line of the Stochastic indicator is higher than the signal line of the Stochastic indicator
String: Bid
Mode: CHANGE
Value: the numerical value of the Bid price change relative to the closing price of the previous bar
Operating modes
Each of the panel rows can work in one of 5 modes:
- YES_NO-output “YES” or “NO” depending on the conditions you set (for example, Price > SMA(30), RSI (14) < 30, EMA (5) > EMA (10),…). You can use the operators ‘<', '>‘and’=’.
- VALUE-displays the current indicator value or price
- CHANGE-displays the change in the indicator or price in relation to the values of the previous bar
- ARROWS – similar to CHANGE mode, but displayed as arrows (up/down)
PERCENT – similar to the CHANGE mode, but the percentage change is displayed.
[spoiler title=”Read More…”]
In YES_NO mode, only one operator must be specified (<,>,=). In all other modes, operators are prohibited.
The panel supports the following built-in indicators:
- Moving averages (SMA, EMA, SMMA, and LWMA)
- Relative Strength Index (RSI)
- Commodity Channel Index (CCI)
- MACD
- Stochastic Oscillator (Stoch)
- Parabolic SAR
- Williams Percent Range (WPR, %R)
- Triple Exponential Average (TRIX)
- Bollinger Bands
- Standard Deviation (StdDev)
- Average True Range (ATR)
- Momentum Oscillator (MOM)
- Relative Vigor Index (RVI)
The panel supports several functions. The case of the letters does not matter. The parameters specified in parentheses can be omitted. For parameters whose values are not set, the default values will be used. For example, you can set the values of the first and second parameters, all three, or not set them at all.
- P or PRICE or BID -> bid price
- ASK -> ask price
- any number, such as 20, 1.4506, -100, …
- CCI(period)
- RSI(period)
- MACD(fast ema, slow ema, macd ema) -> the value of the main line of the MACD
- MACD[M](fast ema, slow ema, macd ema) ->> value of the main line of the MACD
- MACD[S](fast ema, slow ema, macd ema) -> > value of the MACD signal line
- MA(period, shift) -> default-SMA value
- SMA(period, shift)
- EMA(period, shift)
- SMMA(period, shift)
- LWMA(period, shift)
- STOCH(%K, %D, slowing) -> value of the main line of the Stochastic indicator
- STOCH[M](%K, %D, slowing) – > value of the main line of the Stochastic indicator
- STOCH[S](%K, %D, slowing) -> value of the Stochastic indicator signal line
- SAR(step, maximum) or PSAR (step, maximum) -> Parabolic SAR indicator value
- WPR(period) or %R(period)
- TRIX(period)
- BANDS[U] (period, shift, deviation) or BB[U](period, shift, deviation) -> value of the upper band of the Bollinger band indicator
- BANDS[L] (period, shift, deviation) or BB[L](period, shift, deviation) -> value of the lower band of the Bollinger band indicator
- STDDEV (period, shift) or DEV(period, shift)
- ATR(period)
- MOM(period)
- RVI (period) or RVI[M] (period) -> value of the main line of the RVI indicator
- RVI[S](period) -> value of the signal line of the RVI indicator
[/spoiler]