


CustomMultyIndexCreatorDemo allows you to create your own multi-currency custom
symbol based on the history of a basket of three financial instruments (EURUSD, GBPUSD and USDCHF) how
the geometric weighted average of this currency basket and pump up its price history in the form of minute values
bars. Thus, a new symbol appears in the Metatrader 5 client terminal, which can be used for
work by analogy with other financial instruments, that is, open full-fledged charts of any timeframe of this indicator.
create and perform technical analysis, placing any technical and user-defined indicators on these charts.
Features
- The indicator works on the minute timeframe and on any symbol, on other timeframes it switches the chart to
minute timeframe; - Working on the chart of any financial instrument, the indicator allows you to create your own
custom symbol according to the input parameters, but the time markup of the trading sessions will be
similar to the symbol on which the indicator is placed on the chart; - For a single user character in the client terminal
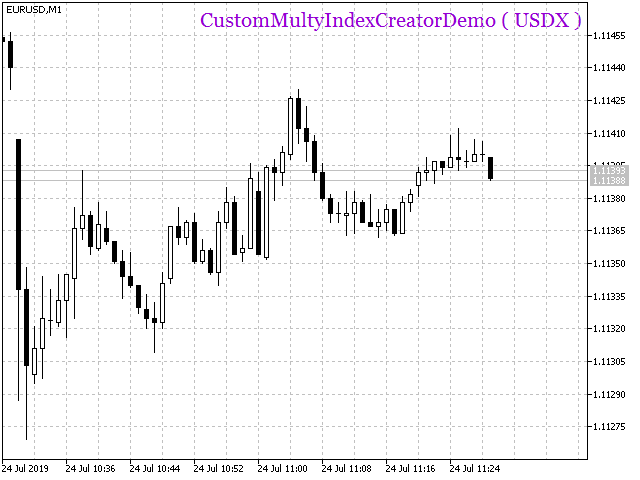
Only one copy of the indicator can be run in Metatrader 5; - The presence of the indicator on the chart of a financial instrument is indicated by the presence of its name in the upper right corner of the chart when
default settings with changing the color of this name on each tick of the terminal; - The input parameters of the indicator are accessed via
List of indicators by pressing Ctrl I, or by using the item
List of indicators in the context menu of the right mouse button on the indicator location chart; - You should take into account the fact that to display even a small number of bars on the higher timeframes, you should have
a huge amount of minute history, from which these graphs are built and which will all be placed on the hard disk
(>20Gb / character)! And therefore, in such a situation, the only way out will be in the settings of the client terminal on the tab
Charts in the checkbox
Maximum number of bars in the select unlimited number of bars in window
window (Unlimited).
Indicator input parameters for a custom index
- CurrencyIndex – The name of the user’s index;
-
name of the symbol from which the custom symbol will be created– Name of the symbol, specification
which will be used as a sample; -
IndexInvert-flipping the graph of the user’s index vertically, that is, getting
reverse quote of the index; - IndexMultiplier – multiplication factor of the received quotes;
- IndexDigits– the number of digits after the decimal point when rounding quotes and displaying the price scale;
-
Smoothing method – the method of averaging the received quotes (in this indicator, the total price values are
timeseries can be averaged); - Smoothed period – the averaging period, by default, the averaging period is five hundred;
-
Smoothed parameter – the averaging parameter, which varies within -100 for JJMA … 100, For VIDIA this is
the CMO period, for the AMA, is a slow moving average period.;
Input parameters for displaying a text name on a graph
- Display the indicator name in the corner of the chart – Display the name on the chart;
- Font size of the indicator name – the font size of the name;
- The offset indicator name horizontal– the horizontal offset of the name;
-
The offset indicator name vertical – the vertical offset of the name
; -
The corner of the indicator name on the chart – one of the four corners of the chart
for the location of the name.
An initial introduction to working with custom symbols can be made by reading the article.
Since the indicator allows you to create full-fledged charts of custom symbols for any financial assets, then
the possibilities of using these charts for technical analysis, formation of trading signals and testing
the experts are quite unlimited. With the default settings, the resulting custom symbol graphs have
a fairly smooth view with a clearly defined trend component and filtered price noise. On such charts
you can test almost all available trading systems.
[spoiler title=”Read More…”]
CustomMultyIndexCreatorDemo allows you to create your own multi-currency custom
symbol based on the history of a basket of three financial instruments (EURUSD, GBPUSD and USDCHF) how
the geometric weighted average of this currency basket and pump up its price history in the form of minute values
bars. Thus, a new symbol appears in the Metatrader 5 client terminal, which can be used for
work by analogy with other financial instruments, that is, open full-fledged charts of any timeframe of this indicator.
create and perform technical analysis, placing any technical and user-defined indicators on these charts.
Features
- The indicator works on the minute timeframe and on any symbol, on other timeframes it switches the chart to
minute timeframe; - Working on the chart of any financial instrument, the indicator allows you to create your own
custom symbol according to the input parameters, but the time markup of the trading sessions will be
similar to the symbol on which the indicator is placed on the chart; - For a single user character in the client terminal
Only one copy of the indicator can be run in Metatrader 5; - The presence of the indicator on the chart of a financial instrument is indicated by the presence of its name in the upper right corner of the chart when
default settings with changing the color of this name on each tick of the terminal; - The input parameters of the indicator are accessed via
List of indicators by pressing Ctrl I, or by using the item
List of indicators in the context menu of the right mouse button on the indicator location chart; - You should take into account the fact that to display even a small number of bars on the higher timeframes, you should have
a huge amount of minute history, from which these graphs are built and which will all be placed on the hard disk
(>20Gb / character)! And therefore, in such a situation, the only way out will be in the settings of the client terminal on the tab
Charts in the checkbox
Maximum number of bars in the select unlimited number of bars in window
window (Unlimited).
Indicator input parameters for a custom index
- CurrencyIndex – The name of the user’s index;
-
name of the symbol from which the custom symbol will be created– Name of the symbol, specification
which will be used as a sample; -
IndexInvert-flipping the graph of the user’s index vertically, that is, getting
reverse quote of the index; - IndexMultiplier – multiplication factor of the received quotes;
- IndexDigits– the number of digits after the decimal point when rounding quotes and displaying the price scale;
-
Smoothing method – the method of averaging the received quotes (in this indicator, the total price values are
timeseries can be averaged); - Smoothed period – the averaging period, by default, the averaging period is five hundred;
-
Smoothed parameter – the averaging parameter, which varies within -100 for JJMA … 100, For VIDIA this is
the CMO period, for the AMA, is a slow moving average period.;
Input parameters for displaying a text name on a graph
- Display the indicator name in the corner of the chart – Display the name on the chart;
- Font size of the indicator name – the font size of the name;
- The offset indicator name horizontal– the horizontal offset of the name;
-
The offset indicator name vertical – the vertical offset of the name
; -
The corner of the indicator name on the chart – one of the four corners of the chart
for the location of the name.
An initial introduction to working with custom symbols can be made by reading the article.
Since the indicator allows you to create full-fledged charts of custom symbols for any financial assets, then
the possibilities of using these charts for technical analysis, formation of trading signals and testing
the experts are quite unlimited. With the default settings, the resulting custom symbol graphs have
a fairly smooth view with a clearly defined trend component and filtered price noise. On such charts
you can test almost all available trading systems.
CustomMultyIndexCreatorDemo allows you to create your own multi-currency custom
symbol based on the history of a basket of three financial instruments (EURUSD, GBPUSD and USDCHF) how
the geometric weighted average of this currency basket and pump up its price history in the form of minute values
bars. Thus, a new symbol appears in the Metatrader 5 client terminal, which can be used for
work by analogy with other financial instruments, that is, open full-fledged charts of any timeframe of this indicator.
create and perform technical analysis, placing any technical and user-defined indicators on these charts.
Features
- The indicator works on the minute timeframe and on any symbol, on other timeframes it switches the chart to
minute timeframe; - Working on the chart of any financial instrument, the indicator allows you to create your own
custom symbol according to the input parameters, but the time markup of the trading sessions will be
similar to the symbol on which the indicator is placed on the chart; - For a single user character in the client terminal
Only one copy of the indicator can be run in Metatrader 5; - The presence of the indicator on the chart of a financial instrument is indicated by the presence of its name in the upper right corner of the chart when
default settings with changing the color of this name on each tick of the terminal; - The input parameters of the indicator are accessed via
List of indicators by pressing Ctrl I, or by using the item
List of indicators in the context menu of the right mouse button on the indicator location chart; - You should take into account the fact that to display even a small number of bars on the higher timeframes, you should have
a huge amount of minute history, from which these graphs are built and which will all be placed on the hard disk
(>20Gb / character)! And therefore, in such a situation, the only way out will be in the settings of the client terminal on the tab
Charts in the checkbox
Maximum number of bars in the select unlimited number of bars in window
window (Unlimited).
- CurrencyIndex – The name of the user’s index;
-
name of the symbol from which the custom symbol will be created– Name of the symbol, specification
which will be used as a sample; -
IndexInvert-flipping the graph of the user’s index vertically, that is, getting
reverse quote of the index; - IndexMultiplier – multiplication factor of the received quotes;
- IndexDigits– the number of digits after the decimal point when rounding quotes and displaying the price scale;
-
Smoothing method – the method of averaging the received quotes (in this indicator, the total price values are
timeseries can be averaged); - Smoothed period – the averaging period, by default, the averaging period is five hundred;
-
Smoothed parameter – the averaging parameter, which varies within -100 for JJMA … 100, For VIDIA this is
the CMO period, for the AMA, is a slow moving average period.;
Input parameters for displaying a text name on a graph
- Display the indicator name in the corner of the chart – Display the name on the chart;
- Font size of the indicator name – the font size of the name;
- The offset indicator name horizontal– the horizontal offset of the name;
-
The offset indicator name vertical – the vertical offset of the name
; -
The corner of the indicator name on the chart – one of the four corners of the chart
for the location of the name.
An initial introduction to working with custom symbols can be made by reading the article.
Since the indicator allows you to create full-fledged charts of custom symbols for any financial assets, then
the possibilities of using these charts for technical analysis, formation of trading signals and testing
the experts are quite unlimited. With the default settings, the resulting custom symbol graphs have
a fairly smooth view with a clearly defined trend component and filtered price noise. On such charts
you can test almost all available trading systems.
[/spoiler]