


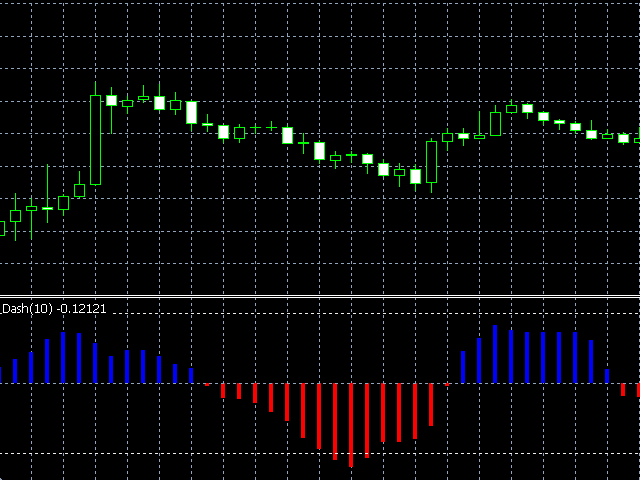

Dash is a histogram indicator that measures the rate of price change and determines the overbought and oversold levels of the market.
The indicator uses price extremes for previous periods and calculates the ratio between the current price and the extremes. Therefore, the only parameter is Period, which sets the number of bars to determine the extremes.
A long position can be opened when the red lines of the indicator begin to leave the oversold zone and break through the -1 level from the bottom up. A short position can be opened when the blue lines of the indicator begin to leave the overbought zone and break through level 1 from top to bottom.
- The Inputs tab of the indicator allows you to select the indicator period;
- The Colors indicator tab allows you to select the color, thickness, and style of the indicator lines;
- The Levels tab of the indicator allows you to select numerical values for overbought and oversold levels.
- period – the number of bars used to calculate the indicator.