


This indicator analyzes the history with a given period and calculates the characteristics of the trading channel:
How to use it:
- The indicator answers the question: where will the price go and by how much. If up, then to the upper border of the channel, and if down, then to the lower one, respectively.
- The probability of a particular direction of movement can be estimated by the relative position of the middle line and the reference line. If the average line is higher than the reference line, then the price tends to increase, and if it is lower, then the opposite is true: it tends to decrease.
- If the price breaks away from the line of the estimated price, it will necessarily (in 90%) touch or break the previous low (if the price is lower) or the maximum (if the price is higher) this line, respectively.
Input parameters:
Buffers:
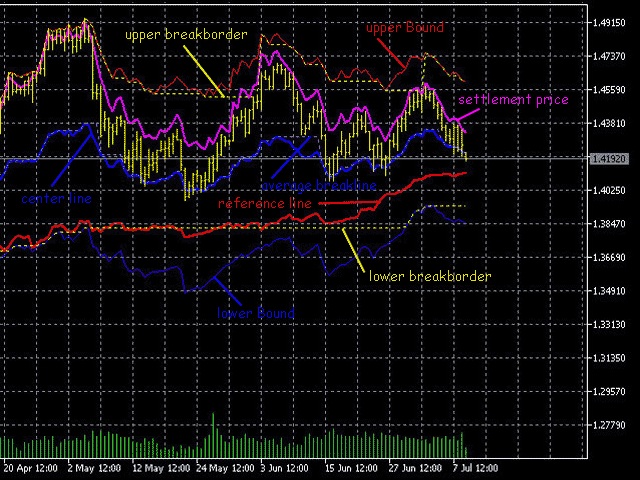
- 0 – Upper bound / / upper Bound
- 1 – Lower bound / / lower Bound
- 2-Middle line / / center line
- 3-Settlement price / / settlement price
- 4-Reference line / / reference line
- 5 – Upper break border / / upper breakborder
- 6-Lower break border / / lower breakborder
- 7-Middle break line / / average breakline