


The equilibrium of requirement and distribution is a simple and reasonably effective method of market analysis.
Even before a trend reversal, graph of supply and requirement tell us in which a paragraph ends and has generated the demand, in which demand is over and has born the offer – substantially increasing the likelihood of trades with high gain factor and in the right direction.
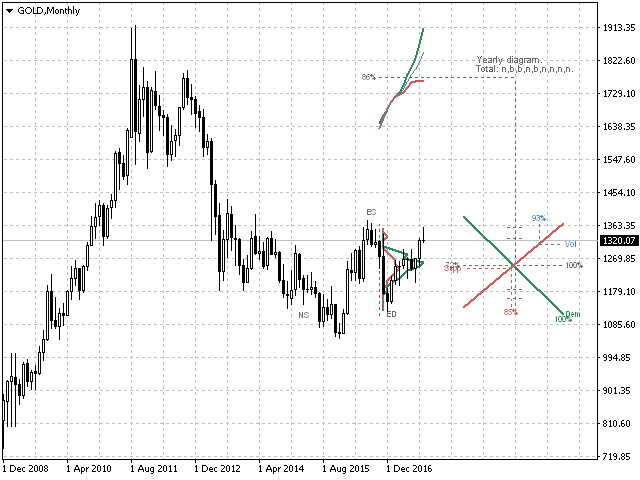
The indicator generates signals based on a combination of price / volume worth:
- ED (excessive demand) – excessive demand.
- ES (surplus supply) – excess supply.
- ND (No demand) – no demand (accompanied by a warning message “sell area”).
- NS (No supply) – no offer (accompanied by a warning message “Buy area”).
It also tracks the sequence of these signals, checks the elasticity of supply/demand to the price, and issues a confirmation message “Buy point”or” Sell point”.
- Alerts-enables / disables the duplication of signals in the alerts window, as well as in the form of Push messages.
- Advise-enables / disables trading hints.
- Labels-enables / disables the display of signal labels on the chart.
- Viewing-enables / disables the chart display completely (Alerts and Advise retain their functionality if enabled).
- Position – the location of the chart, which is built on a time scale.
- Average-mode for calculating the average point of the chart, moving average or weighted average based on volume.
- Deviation – the mode for calculating the amplitude of the diagram, the maximum deviation, either the standard deviation or the deviation through the Hurst exponent.
- Signal – a set of data (supply and demand and / or total volume) that will be used to generate a trading signal.
- Reverse-enables / disables the chart calculation mode in terms of limit orders.
- excessvalidate-mode for tracking a sequential bundle of signals, the option works as an additional filter.
- elasticityvalidate-check the elasticity of supply/demand to the price, with a choice of options by the type of position opening, the option works as an additional filter.
- Profile – the mode of calculating the volume profile, the usual profile, the difference profile, as well as the open interest profile obtained mathematically by pre-zeroing the mutually absorbing volumes.
- Timing – frequency of chart recalculation.
- Volumes – type of volumes, tick or real, if they are transmitted from the broker.
- tfshift – shift of the applied period.
- Correlation-enables / disables the mode of checking the correlation of trading signals of the current and higher timeframes.
- lowlevelvalue – the value below which the volume is considered low, set as a percentage.
- lowestlevelvalue – the value below which the volume is considered very low, set as a percentage.
- highlevelvalue – the value above which the volume is considered high is set as a percentage.
- highestlevelvalue – the value above which the volume is considered very high is set as a percentage.
- periodforxx – any period for a specific timeframe.
- durationparts – the number of sectors of the chart, which is built on a time scale.
- standarddeviations-multiplier for the standard deviation mode.
- hurstexponent is the exponent for the deviation mode via the Hurst exponent.
- profilemaxlengthpix-limit the length of drawing the profile in pixels of the monitor.
- leftshiftpix-chart offset to the left, set in pixels of the monitor.
- widthpix – the width of the chart, set in pixels of the monitor.
- FontSize – the font size.
[spoiler title=”Read More…”]
The other variables relate to the color and line thickness settings, and their purpose is clear from their name.
The presence of the “Buy point” / “Sell point” signal is expressed by a text message, and is also accompanied by the flashing of the corresponding price tag, only these two combinations together should be perceived as the correct presence of the signal.
A complete recalculation of the chart is performed by the value of the variable Timing, checking for the presence of a signal is performed on each tick.
A line whose thickness is set to zero is not displayed and does not participate in signal generation.
For the indicator, you can scroll the chart and view the chart and its signals on the history.
Alerts and trading tips are issued for periods starting from the current one and above.
The volumes in the chart are cumulative and normalized to a percentage.
[/spoiler]