


Allows you to display on each open chart the information necessary for the correct execution of the transaction. For example: the size of the spread; the size of the swap; the day of the triple swap; the closing time of the session; the ATR of the symbol for the Counter; the total amount of profit/loss for this symbol; the number of previously made transactions; the percentage by which the quote for the 6 instruments you selected changed; and much more.
The spread size is always displayed. The output of the rest of the information depends on the selected settings:
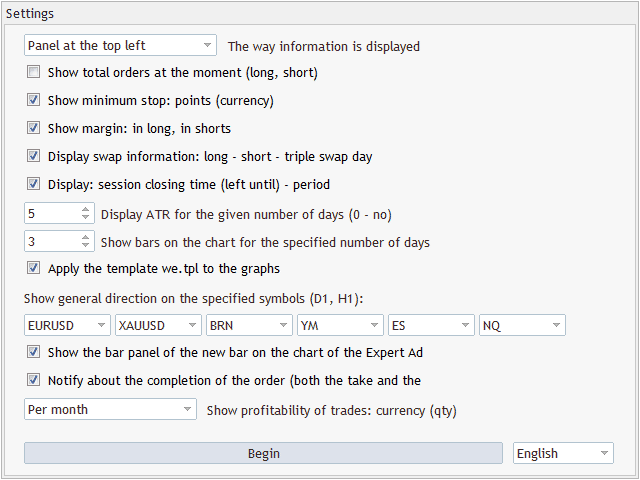
- Show total orders at the moment (long, short). If the broker provides such information, then it displays the volume of transactions in long and short for today.
- Show minimum stop: points (currency). Display the distance of the minimum stop (in points and in the profit currency) from the current price. For example, if min. stop is 5 cents, and the current price is $ 10, then you can not put a stop at the price of $ 9.97 – at least at the price of $ 9.94.
- Show margin: in long, in shorts. Show the collateral margin required for the purchase of mines. lot.
- Display swap information: long – short – triple swap day. Show information about the swap (the amount to be paid for the transfer of the position) for both long and short positions. The day of the triple swap for this instrument is also displayed.
- Display: session closing time (left until) – period. Display the closing time of trading on the instrument, as well as how much time is left before closing. If a time interval is currently selected on the chart that is less than the daily interval, then the number of minutes remaining before the opening of a new bar is also displayed.
- Apply the template we.tpl to the graphs. If this check box is selected, then a template named my will be automatically applied to each chart you open. Please note that before you select this check box, you need to create the my template itself. You can do this by using the Templates item/Save template … for the graph context menu. The templates store indicators, the selected scale, the chart type, and other information, including the Expert Advisor that is currently on the chart. For this reason, do not create a template on the chart where this Expert Advisor is running. Otherwise, when you open each new chart window, this Expert Advisor will also run on it.
- Show the bar panel of the new bar on the chart of the Expert Advisor. Display an additional panel on the chart where this Expert Advisor is running, with information about the time when a new bar appears for different time intervals. If you check the box next to any time interval of this panel, then a minute before the start of a new bar on the selected time interval, the Expert Advisor will notify you with a sound signal.
- A quick way to check/uncheck the box is to press the desired number on the keyboard. For example, 1-for M15, 2 – for M30, etc.
- Notify about the completion of the order (both the take and the stop loss). Notify with a sound signal about the occurrence of a take profit or stop loss on current trades.
- Display ATR for the given number of days (0 – no). Display the daily ATR of the instrument by the Sensor. That is, without taking into account abnormally large or small bars.
- Show bars on the chart for the specified number of days. Display a vertical line on the bar that separates the number of days you have selected. That is, with this setting, you can visually see on the chart where the bars end for the last, for example, 3 days.
- Show general direction on the specified symbols (D1, H4). Allows you to display the percentage of changes in quotes for the day and for the last hour for the 6 selected instruments. Thanks to this, you can easily assess the overall trading background in the market.
- Show profitability of trades: currency (qty). Display statistics on previously made transactions on this instrument: the amount of profit or loss, the total number of transactions, the number of profitable and the number of unprofitable transactions.
[spoiler title=”Read More…”]
It is enough to attach the Expert Advisor to one of the charts, and the selected information will be displayed on each chart. The display method depends on the value you selected in the The way information is displayed drop-down list. You can display the information either in the chart comment (in the upper-left corner), or in a separate panel in one of the 4 corners.
The demo version only works on the first 2 characters.
[/spoiler]