


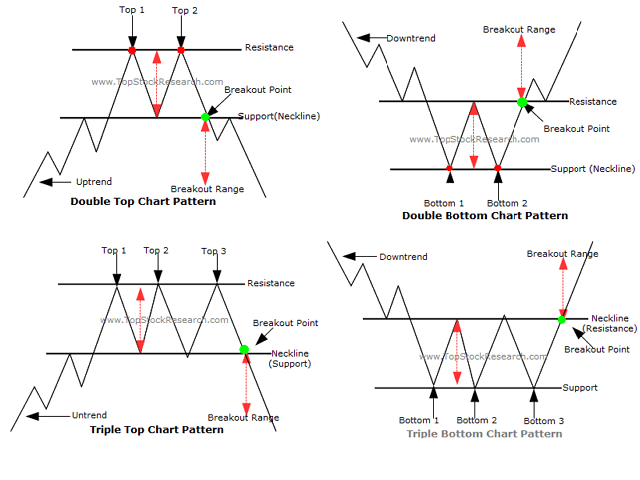

This multi time frame and multi symbol indicator identifies double or triple top/bottom formations or a following neckline breakout (confirmed top/bottom). It has RSI, pin bar and MACD or RSI divergence filter options which makes it possible to filter out only the strongest setups.
The indicator writes the signals to a text file which can also be used by an Expert Advisor (EA) for auto trading. For instance this product. Information in the text file: [symbol],[timeframe],[price of first top],[price of neckline],[buy or sell (0=buy, 1=sell)],[time of first extremum],[time of neckline],[time of second extremum] 3 additonal parameters which will be used only by the EA mentioned above.
- Can monitor all symbols visible in your Market Watch window at the same time. Apply the indicator to just one chart and instantly monitor the entire market.
- Monitors every timeframe, from M1 to MN, and sends you a real-time alert when when the second or third top/bottom is identified or at neckline breakout.
- Can use RSI as a trend filter and/or divergence to properly identify potential reversals.
- The indicator includes an interactive panel. When clicking on an item a new chart will be opened with the symbol and time frame in question.
[spoiler title=”Read More…”]
It is enough to place the indicator on one chart and you will receive an alert from any symbol and any time frame of your choice.
The description and explanation of the input parameters can be found here.
Please note that due to the multifunctionality neither buy and sell advice nor lines and arrows will be drawn on the indicator chart. A line between the extremums as well as the neckline will be drawn on the chart which can be opened from the panel.
I recommend you to put the indicator on a EURUSD M5 chart, preferable a clean chart without any other indicators or Expert Advisor on it.
[/spoiler]