


To test, please download the demo version. It is free for 13 currency pairs (NZD and CHF Crosses).
Double top and bottom patterns are chart patterns that occur when the underlying investment moves in a similar pattern to the letter “W” (double bottom) or “M” (double top). Double top and bottom analysis are used in technical analysis to explain movements in a security or other investment, and can be used as part of a trading strategy to exploit recurring patterns.
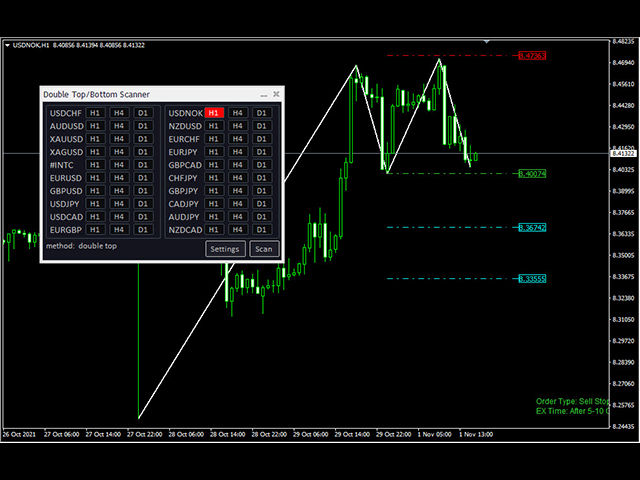
Searching for this pattern among the charts is time consuming, this indicator searches among the symbols that selected by the user, and finds the double top/bottom pattern.
This indicator as an effective tool can be part of the strategy, used as an independent strategy or combined with another method.
For example: this indicator can be used when a divergence occurs or when a double top/bottom pattern is found, a momentum indicator in higher time-frame can be used for confirmation….
Each time several symbols are scanned, the indicator may find patterns, but in the end, is up to you to determine if the pattern that found is valid or not, then take the position.
[spoiler title=”Read More…”]
Capabilities:
- Searching up to 100 symbols in 8 time-frames (800 different modes).
- Graphical display of patterns.
- Display the suggested order parameters(price/sl/tp) to simplify positioning.
- Sending the alert and push notification
- Simple user interface
Notice: Searching for several different symbols and time-frames may take a few seconds (depends on the number of symbols), after pressing the scan button to search you may see a few seconds lag to display results (which is normal).
Observe the following, to improve the performance of the indicator:
Using this indicator is very simple and hope it will improve your trading result.
[/spoiler]