


DYJ TRENDWAVE uses an advanced algorithm to detect a new trend and continue the current one.
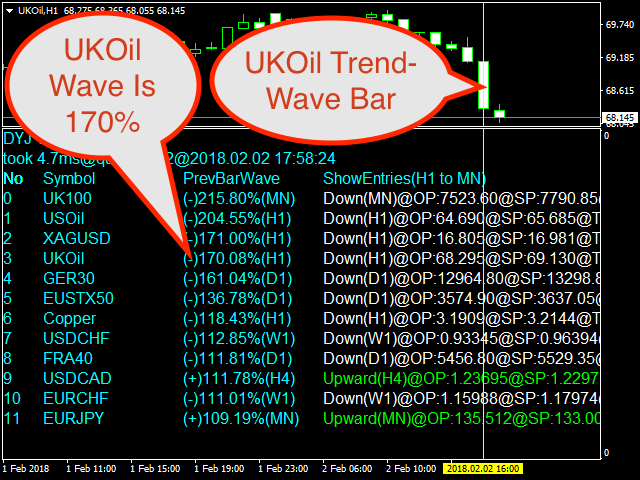
The volatility of the DYJ TRENDWAVE is based on the strength of buyers and sellers. It gets information about the size of the candle bodies and displays the ratio of buyers and sellers as a % of the total volume in the form of Sellers: (- ) 100% and Buyers: ( ) 100%. This information can be used for any entry and exit strategy.
For bullish / long pin bars, they are below the price line, for bearish / short pin bars, they are above the price line. It also filters out false signals.
- Tracks all pairs at the same time.
- By default, the indicator tracks the symbols available in the “Market Overview”, but you can specify a smaller number of pairs if you want.
- Tracks all timeframes: from M1 to MN.
- This is a multi-currency indicator that can be run on a single chart (the recommended timeframe is H4 or D1).
- Pairs – comma-separated trading symbols. If not specified, the current symbols from the Market Overview window are used.
- MinTimeFrame = H1 – minimum timeframe.
- MaxTimeFrame = MN is the maximum timeframe.
- InpBuyColor = clrLime – the color of the sell signal.
- InpSellColor = clrWhite – the color of the buy signal.
- Send_Email = true-send notifications by email.
- Snow_Alert = false-show a pop-up alert.
- Mobile_Alert = true-send notifications to mobile devices.
- Additional_Text = Message from My DYJ TRENDWAVE: – custom message.
[spoiler title=”Read More…”]
- Daying Cao, an experienced software engineer.
[/spoiler]