


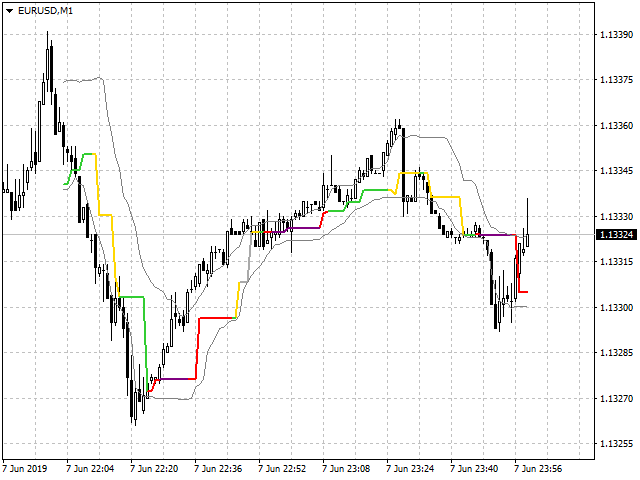

The indicator calculates volume profiles dynamically and outputs the result as VAL, VAH, and POC curves.
The indicator uses historical data of the lower (relative to the current) timeframes for calculations:
- M1 – for timeframes up to H1,
- M5 – for the H1 timeframe,
- M15 – for the H4 timeframe,
- H1 – for the D1 timeframe,
- H4 – for the W1 timeframe,
- D1 – for the MN timeframe.
The color of the sections of the DPOC curve is determined by a cumulative comparison of the volume of the POC levels of all the profiles that make up this curve.
A complete recalculation of the entire curve is performed when the chart scale changes, when the chart scrolls, when the timeframe is switched, and when a new candle appears. However, the value of the curve on the last candle is recalculated constantly, with a frequency of once per second.
- PocPeriod-the length of the base profile, set in candlesticks, with a value of zero, the length is assigned automatically, depending on the current timeframe:
- M1 – 15 candles (15 minutes),
- M5 – 12 candles (1 hour),
- M15 – 16 candles (4 hours),
- M30 – 16 candles (8 hours),
- H1 – 24 candles (1 day),
- H4 – 30 candles (1 week),
- D1 – 22 candles (1 month),
- W1 – 13 candles (1 quarter),
- MN – 12 candles (1 year).
- ValueArea – the size of the cost zone as a percentage.
- ValueAreaType – method for calculating the cost zone:
- OfPocND – normal distribution relative to the POC level.
- OfTotalVolume-distribution of the volume traded in the profile.
- VolumesType – the type of volumes used in calculations:
- Tick – tick boxes.
- Real – real, if transmitted from the broker.
- Without – without taking into account the volume, according to the TPO principle, but based on the lower timeframe.
- BarsLimit-limit the number of candles in the area where the DPOC curve will be plotted.
- VALColor – the color of the VAL curve.
- VAHColor – the color of the VAH curve.
- LowestPocColor, LowPocColor, MiddlePocColor, MediumPocColor, HighPocColor, HighestPocColor – a group of variables that determine the color of sections of the DPOC curve, depending on the volume value.
[spoiler title=”Read More…”]
- M1 – 15 candles (15 minutes),
- M5 – 12 candles (1 hour),
- M15 – 16 candles (4 hours),
- M30 – 16 candles (8 hours),
- H1 – 24 candles (1 day),
- H4 – 30 candles (1 week),
- D1 – 22 candles (1 month),
- W1 – 13 candles (1 quarter),
- MN – 12 candles (1 year).
- OfPocND – normal distribution relative to the POC level.
- OfTotalVolume-distribution of the volume traded in the profile.
- Tick – tick boxes.
- Real – real, if transmitted from the broker.
- Without – without taking into account the volume, according to the TPO principle, but based on the lower timeframe.
[/spoiler]